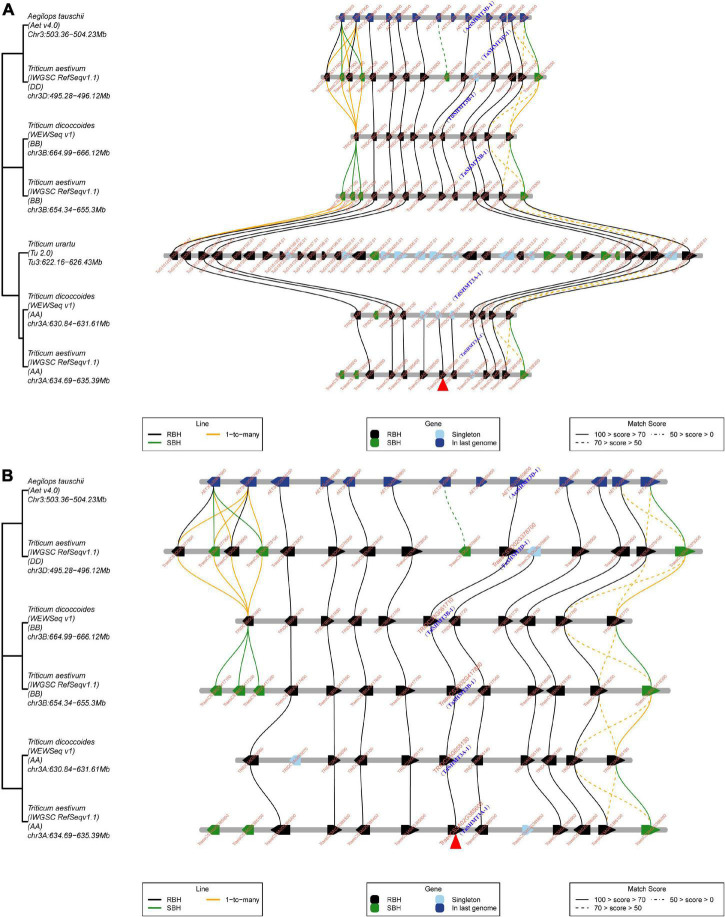
FIGURE 3.
Micro-collinearity analysis by TGT to track the evolutionary history of TaSHMT3A-1 gene homologs. (A,B) TaSHMT3A-1 was used as the query gene. The micro-collinearity relationship showed that no homolog of TaSHMT3A-1 and its two neighboring genes was found in the collinearity region of T. urartu, but other genes were relatively conserved across other investigated genomes and there were 27 genes inserted into the collinearity region of T. urartu. The red arrow indicates TaSHMT3A-1 (A). In the micro-collinearity relationship analyze the genome of T. urartu was deleted. The neighboring genes of TaSHMT3A-1 were conserved across investigated genomes and homologs of TaSHMT3A-1 were found in all investigated genomes (B). Blackline, 1-to-1-mutual-best. Greenline, 1-to-its-best. Yellowline, 1-to-many. RBH, “reciprocal best hits”; SBH “single-side best hits”.

