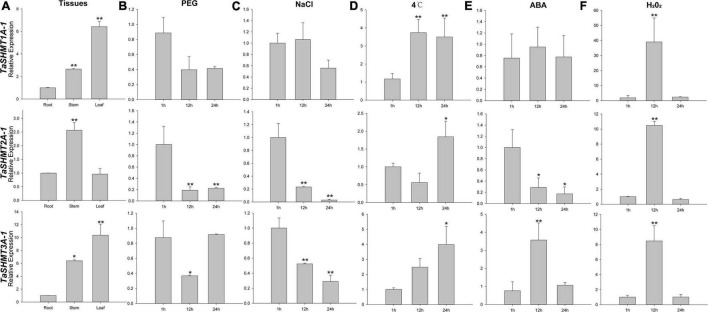
FIGURE 4.
Relative expressions of three TaSHMT genes in different tissues, under different abiotic stresses and response to ABA and H2O2 treatment by qRT-PCR. Expression profiling of TaSHMT genes. Tissues were sampled from Sumai3 at the adult stage (A). Fourteen -day -old seedling leaves were sampled after 1, 12, and 24 h under stress conditions comprising 20% PEG6000 (B), 200 mM NaCl (C), cold (4°C) (D), 100 μmol H2O2 (E) and 100 μmol ABA (F). Asterisks indicate significant differences (assessed using Duncan’s honestly significant difference test), *P < 0.05, **P < 0.01. All the raw data for qRT-PCR are listed in Supplementary Table 3.

