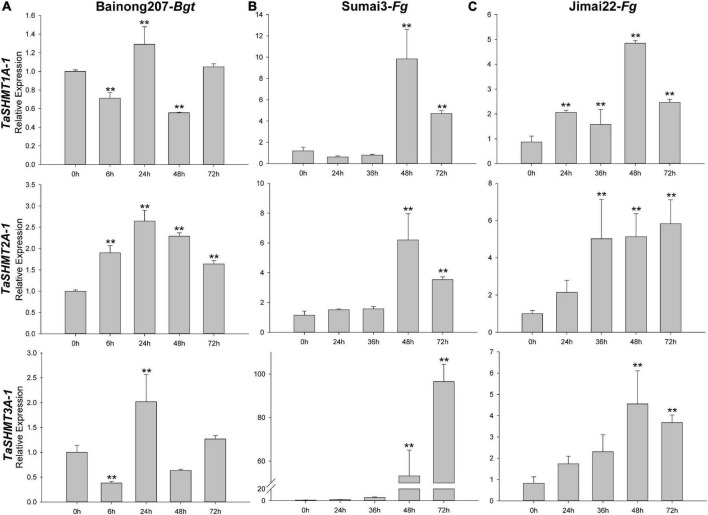
FIGURE 5.
Relative expressions of three TaSHMT genes after Bgt inoculation and F. graminearum by qRT-PCR. Expression profiling of three TaSHMT genes in response to Bgt (A) and F. graminearum (B–C). Data were normalized to the TaTubulin gene. The values are the means of three technical replicates of one biological experiment. Error bars indicate the standard error. Asterisks indicate significant differences (assessed using Duncan’s honestly significant difference test), **P < 0.01. Bgt, Blumeria graminis f. sp. tritici; Fg, Fusarium graminearum.

