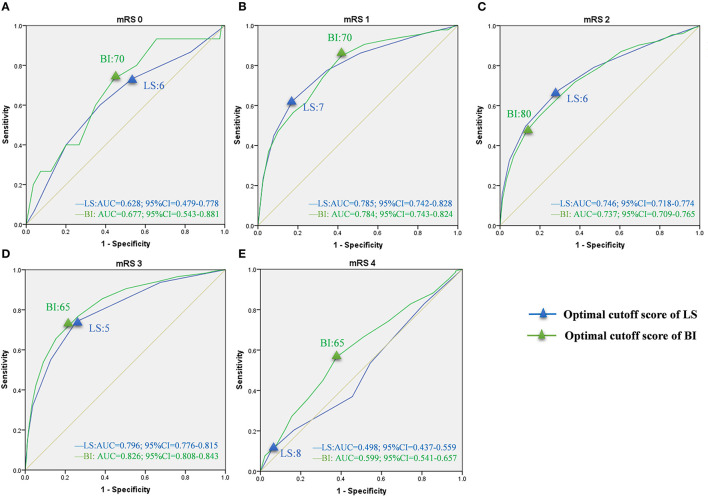
Figure 4.
ROC curves of LS and BI cutoff scores corresponding to mRS grades in the domestic group. LS, Longshi Scale; BI, Barthel Index Scale; mRS, modified Rankin Scale; ROC, Receiver Operating Characteristic; AUC, Area Under Curve; CI, Confidence Interval. (A) ROC curves for LS and BI cutoff scores in mRS 0. Optimal cutoff score: 6 and 70; Sensitivity: 60.0 and 73.3%; specificity: 62.8 and 55.6%; AUC: 0.628 and 0.677, respectively. (B) ROC curves for LS and BI cutoff scores in mRS 1. Optimal cutoff score: 7 and 70; Sensitivity: 62.3 and 84.8%; specificity: 82.7 and 58.3%; AUC: 0.785 and 0.784, respectively. (C) ROC curves for LS and BI cutoff scores in mRS 2. Optimal cutoff score: 6 and 80; Sensitivity: 67.8 and 54.6%; specificity: 70.5% and 80.4%; AUC: 0.746 and 0.737, respectively. (D) ROC curves for LS and BI cutoff scores in mRS 3. Optimal cutoff score: 5 and 65; Sensitivity: 74.0 and 76.9%; specificity: 74.7 and 73.5%; AUC: 0.796 and 0.826, respectively. (E) ROC curves for LS and BI cutoff scores in mRS 4. Optimal cutoff score: 8 and 65; Sensitivity: 10.6 and 94.4%; specificity: 56.6 and 62.2%; AUC: 0.498 and 0.599, respectively.

