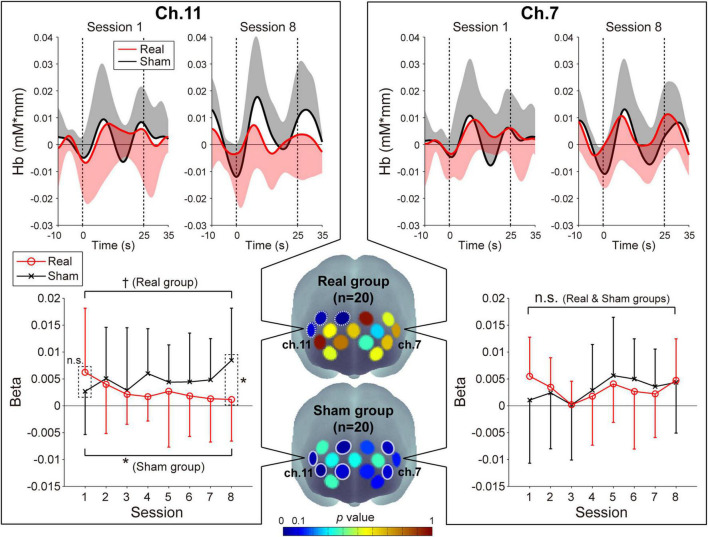
FIGURE 2.
Neuromodulations of the prefrontal cortex activity during the neurofeedback training task. Upper panels: The temporal profiles of the oxy-Hb signals in ch.11 (left panels) and ch.7 (right panels). The red and black lines represent the time courses of the oxy-Hb signals in the Real and Sham groups, respectively. The lighter colored regions around the time course lines denote the standard deviation. The upper or lower directional standard deviation regions are shown for the profiles of the Real and Sham groups, respectively. In ch.11, compared to the first session, the oxy-Hb signal in the final session tended to decrease in the Real group and increase in the Sham group. Lower panels: Beta value transitions in ch.11 (left panels) and ch.7 (right panels). In the first session of ch.11, although there was no significant difference in the beta value between the Real and Sham groups, the Real group showed significantly lower activity than the Sham group at the final session. In contrast, in ch.7, no significant beta value change was observed in both groups. Middle lower 3D brain illustrations: Spatial configurations of the p-values from the simple-simple main effect test comparing the beta value in the first session and that in the last session. In the Real group, activities focally decreased in the right hemisphere, including the feedback channel (white dotted circles), while in the Sham group, large activity increases were observed in the bilateral broad region (white solid circles). Error bars denote the standard deviation. †p < 0.1, *p < 0.05.

