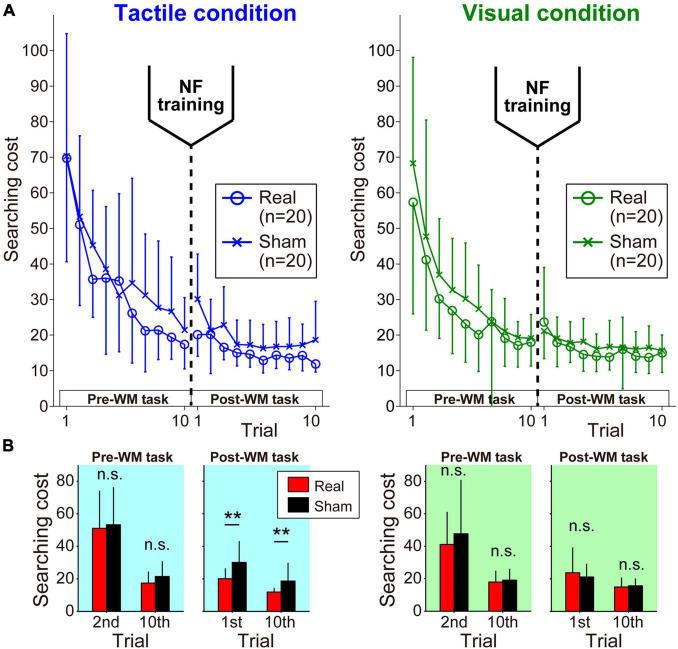
FIGURE 3.
Learning curves during pre- and post-WM tasks. (A) In each task phase, the participants successfully reduced the searching cost. (B) The Real group showed significantly better performance in the Post-WM task only under the tactile condition. Error bars denote the standard deviation. **p < 0.01.

