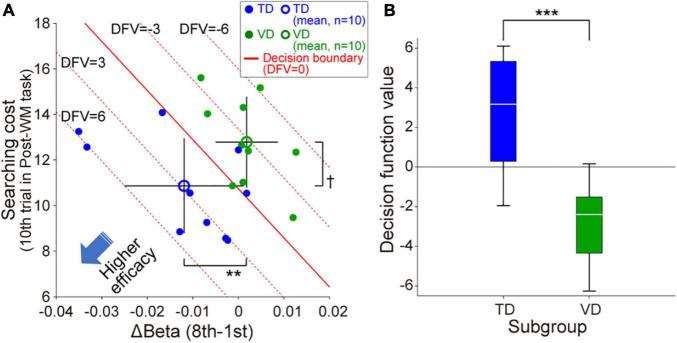
FIGURE 4.
Individual modality dominance dependency of neurofeedback training efficacy in the Real group. (A) Scatter plot of the individual neurofeedback training efficacy based on the beta value change in ch.11 and WM task performance in the Post-WM task. TD-individuals are relatively distributed in the lower left of the scatter plot compared with the VD individuals. The red solid line indicates the decision boundary estimated by linear discriminant analysis [i.e., the decision function value (DFV) is zero on this decision boundary]. The red dotted lines represent other DFVs (6, 3, –3, and –6, respectively). Error bars of the mean values denote the standard deviation. (B) The decision function values for the TD-individuals were significantly higher than those for the VD individuals. †p < 0.1, **p < 0.01, ***p < 0.001.

