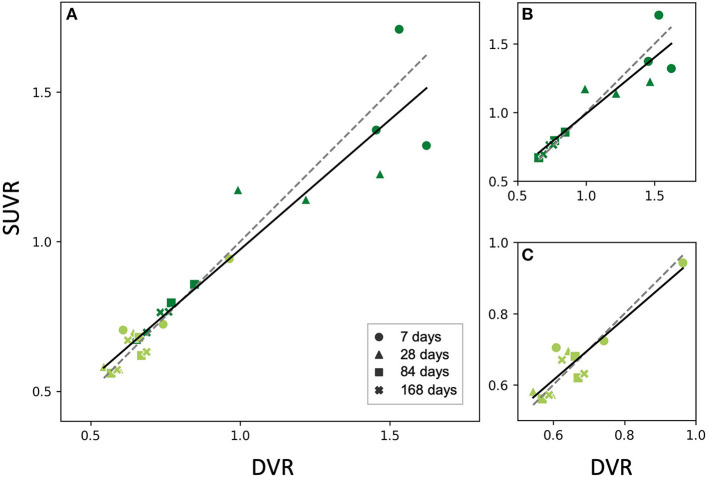
Figure 5.
Relationship between SUVR and DVR from the static 60–90 min scan in the PT VOI of the studied mice (all time points). Dark green dots indicate PT mice, light green dots represent sham mice (A) PT and sham mice together, fit parameters: SUVR = 0.87•DVR+0.11, r = 0.95, p < 10−12, (B) PT mice only, fit parameters: SUVR = 0.82•DVR+0.17, r = 0.92, p < 10−4, (C) Sham mice only, fit parameters: SUVR = 0.86•DVR+0.10, r = 0.91, p = 10−4. All the fits (solid lines) are close to identity line (dashed). The marker shape represents the time after the surgery.

