
Figure 6.
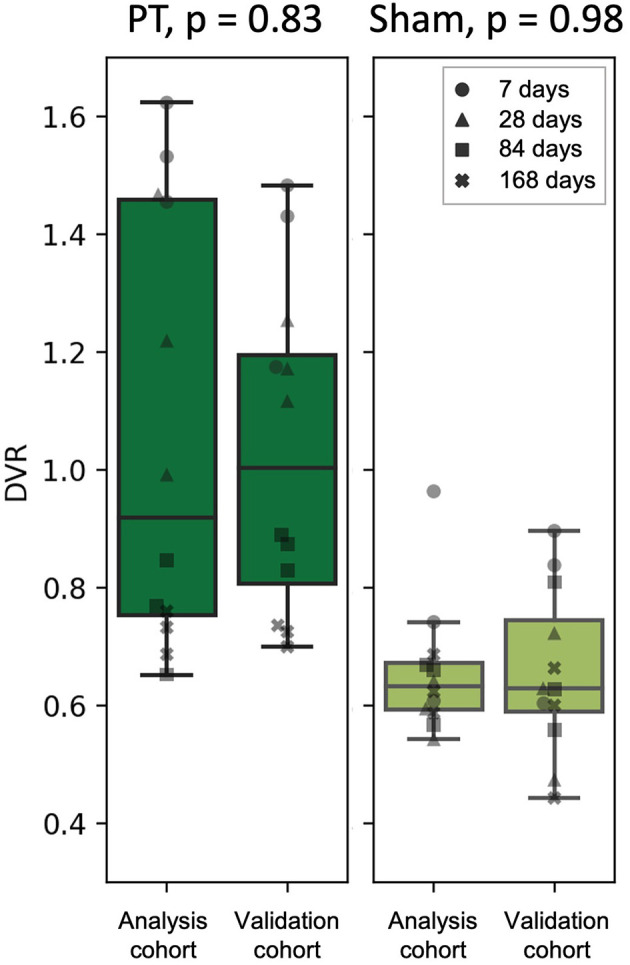
DVR calculated using Logan plot with IDIF (analysis cohort) against DVR estimated from the linear fits (validation cohort) for the PT mice (left) and the sham mice (right). The marker shape represents the time after the surgery.
Official websites use .gov
A
.gov website belongs to an official
government organization in the United States.
Secure .gov websites use HTTPS
A lock (
) or https:// means you've safely
connected to the .gov website. Share sensitive
information only on official, secure websites.
DVR calculated using Logan plot with IDIF (analysis cohort) against DVR estimated from the linear fits (validation cohort) for the PT mice (left) and the sham mice (right). The marker shape represents the time after the surgery.