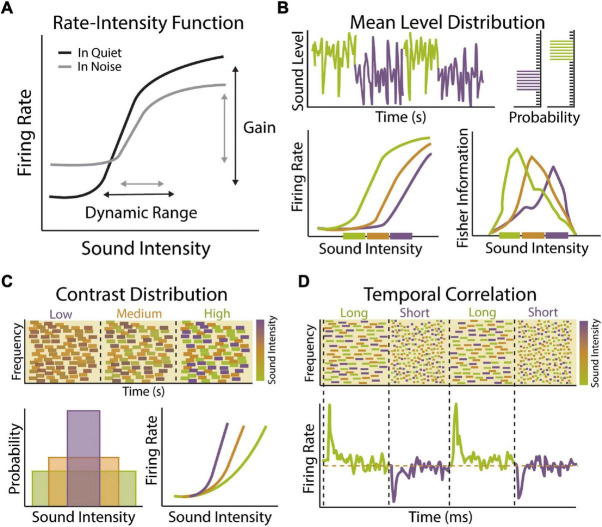
FIGURE 1.
Stimulus statistic adaptation in the auditory system. (A) Example rate-intensity function showing input–output relationship of sound intensity and auditory neuron firing rate in quiet (black) or in the presence of background noise (gray). Auditory neurons encode sound level information through changes in mean firing rate. The neuron’s response gain is defined as the rate at which neuronal firing increases as a function of increasing sound level input. The dynamic range of a neuron is defined as the range of stimulus values encoded by a neuron though changes in its firing rate. A majority of auditory neurons exhibit low thresholds with firing rates that saturate to low or moderate sound levels, limiting their dynamic range. Both the gain and dynamic range of auditory neurons become compressed in the presence of background noise, which can be compensated for in part by adaptation to sound level statistics. (B) Example of dynamic range adaptation in a central auditory neuron or auditory nerve (AN) fiber. Top: Switching stimulus with high probability density region (HPR) at low (green) or high (purple) sound intensity levels. Within each environment, the range of intensities is drawn from a statistically defined high probability region confined to a narrow range of intensity while the remaining stimuli are drawn from a broader range of intensities outside the HPR (top right). Bottom: Auditory neurons adapt their threshold and dynamic range so that they are most sensitive to sound intensities within in the HPR, indicated by thick colored bars on x-axis (bottom left). Fisher information measure of coding accuracy for rate-intensity functions indicates that dynamic range adaptation acts to improve accuracy of sound intensity coding for sound levels most likely to be encountered in current environment (bottom right). Schematized data adapted from Dean et al. (2005). (C) Example of contrast gain control in a central auditory neuron. Top: Spectrogram of dynamic random chord (DRC) stimuli with low, medium or high contrast in sound intensity levels. Bottom: Theses spectrotemporally complex stimuli have same mean sound level but different sound level variance (bottom left). Neuronal gain shifts with changes in contrast (bottom right). Response gain is steep in low contrast environments (purple), allowing neurons to be sensitive to small changes in sound intensity, but becomes progressively shallower in medium (orange) and low (green) contrast environments, allowing neurons to maintain sensitivity to a larger range of intensities. Schematized data adapted from Rabinowitz et al. (2011). (D) Example of gain adaptation to changes in temporal correlation of sounds in central auditory neuron. Top: A series of DRCs with dynamically changing temporal correlation structure. Bottom: Auditory neurons respond to transition in temporal correlation structure by brief increases or decreases in firing rate, followed by steady state firing rates (orange dashed line). These transient changes in firing rate are indicative of adaptation to statistical change in stimulus, indicating that auditory neurons can adapt to the temporal dynamic range of the inputs to preserve encoding efficiency under varying statistical constraints without changing overall activity levels. Schematized data adapted from Natan et al. (2016).

