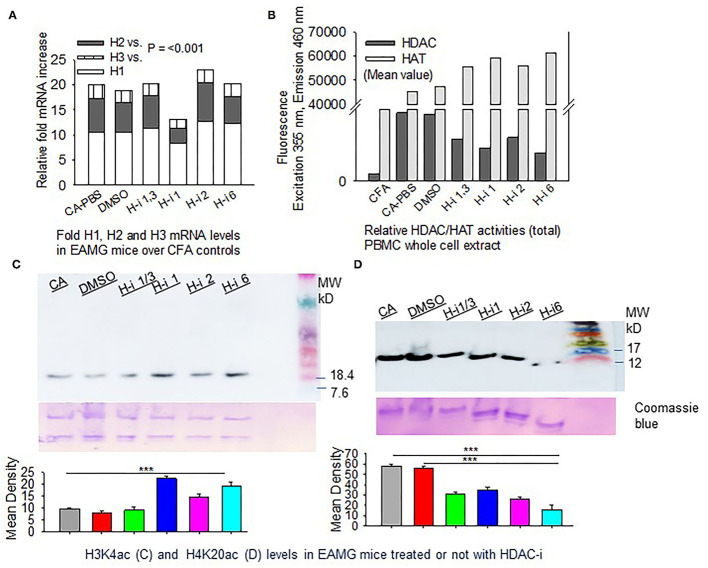
Figure 3.
HDAC expression and HDAC vs. HAT activities in PBMCs. CFA and EAMG mice (± HDAC-i) were bled 72 h post 2nd and 3rd treatments. (A) Relative mRNA fold changes of HDAC isoforms 1, 2, and 3 in AChR-stimulated PBMCs from post 3rd treatment. (B) Relative HDAC/HAT total enzymatic activities in the whole-cell extract of AChR-stimulated PBMCs from post 2nd treatment. Data (fluorescence intensity) shown are the mean values of the pooled samples in wells assayed in duplicate (n = 3 for CFA; n = 5 for CA-PBS and each treatment groups). (C,D) Immunoblots showing H3K4ac and H4K20ac in whole-cell lysates of splenocytes from EAMG mice treated or not with HDAC-i. Bottom panel: nonspecific bands to show loading uniformity in the gel stained with Coomassie blue. The experiment was repeated thrice. ***P < 0.001, ANOVA.

