Figure 7.
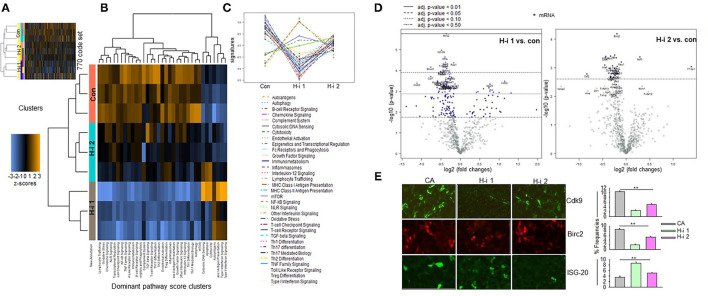
nCounter gene expression panel. Expression profiling of autoimmune-associated genes using the NanoString nCounter system. (A) Heatmap shows expression intensities of 770 autoimmune-associated genes clustered in rows (blue reflecting lower and brown showing higher abundance mRNAs). The columns represent pooled DMSO controls (lanes 1–3) and H2- (lanes 4–6) and H1- (lanes 7–9) treated spleen mRNA samples from EAMG mice (n = 5 per group, samples pooled) 4 weeks post 3rd treatment with HDAC-i. (B,C) Pathway scores. Pathway heatmap score and score plot reflect an overview of the dominant pathways affected by treatments of HDAC1 (H1) or HDAC2 (H2) relative to the baseline solvent controls (Con). Pathway average scores (shown by lines) represent the gene expression profile of each sample compressed into a small set of pathway scores. These scores are placed using the first principal component of each gene set data; in general, an increased score corresponds to increased expression. (D) Volcano plot depicts the distribution of the estimated log fold change or differential expression of each gene relative to the baseline or controls. Highly statistically significant genes are above the horizontal lines (p-value thresholds), and differentially manifested highly-repressed or highly-expressed genes are on the left or right sides, respectively. Up to 20 of the most statistically significant genes are represented by colored dots in the plot. Highly up/downregulated genes in the volcano plot are described in Tables 1, 2. (E) Shown are the fluorescence microscope captured images of spleen sections from DMSO, HDAC-i 1, and HDAC-i 2 treated EAMG mice. The images are representative views from the sections stained with Cdk9, IAP-1, and ISG-20 specific Alexa-conjugated Abs. A semi-quantitative assessment of fluorescence-deposits indicates relative protein abundance in samples (bar graphs). Result is representative of three independent experiments. Vertical bars represent standard error, n = 3 per group. **P < 0.01.

