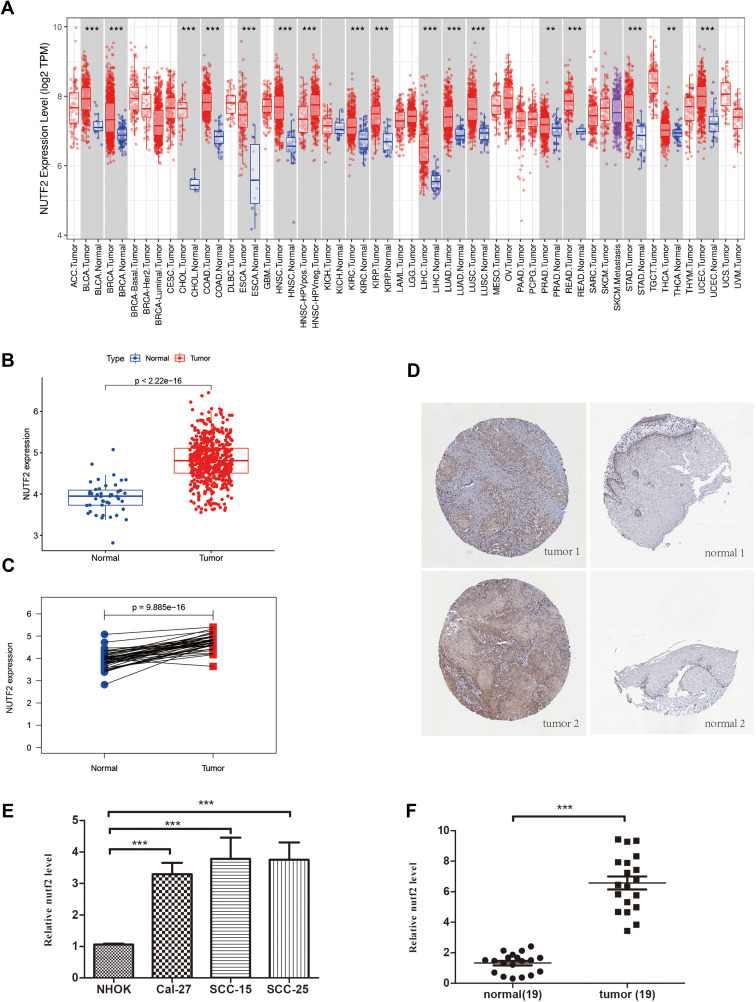
Figure 1.
The different NUTF2 expression in multiple cancers. (A) The different NUTF2 expression in TCGA Pan-cancer samples including tumor and normal tissues analyzed by TIMER database (“**” indicates a P -value ≤0.01, “***” indicates a P -value ≤0.001). (B) Scatter plot shows the differential expression of NUTF2 gene in HNSC tissues (N = 518) and tumor-adjacent normal tissues (N = 44). (C) Paired plot shows the differential expression of NUTF2 gene in HNSC and tumor-adjacent normal tissues (N = 13) (p<0.001). (D) Expression of NUTF2 proteins in different tumor tissues and paired normal tissues in HNSC by HPA. (E) Expression of NUTF2 mRNA in HNSC cell lines and non-cancerous cell line (F) Expression of NUTF2 mRNA in HNSC tumor samples and adjacent non-cancerous tissues.

