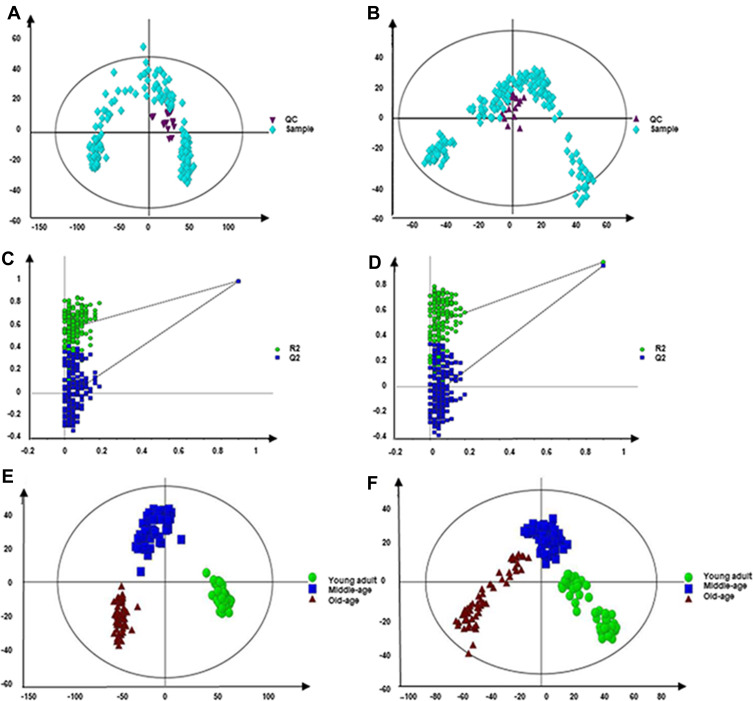
Figure 1.
PCA scores plot and validation plot of permutation testing of PLS-DA model. (A and B) PCA scores plot generated from serum samples of participants and QC in positive and negative mode. Purple triangle, QC. Light blue diamond, Sample. (C and D) The validation plot of permutation testing of PLS-DA model. (E and F) PLS-DA score plots generated from serum samples of participants in different age groups. Green dot, young group. Blue box, middle-aged group. Crimson triangle, old-aged group. (A, C and E) the positive mode. (B, D and F) the negative mode.

