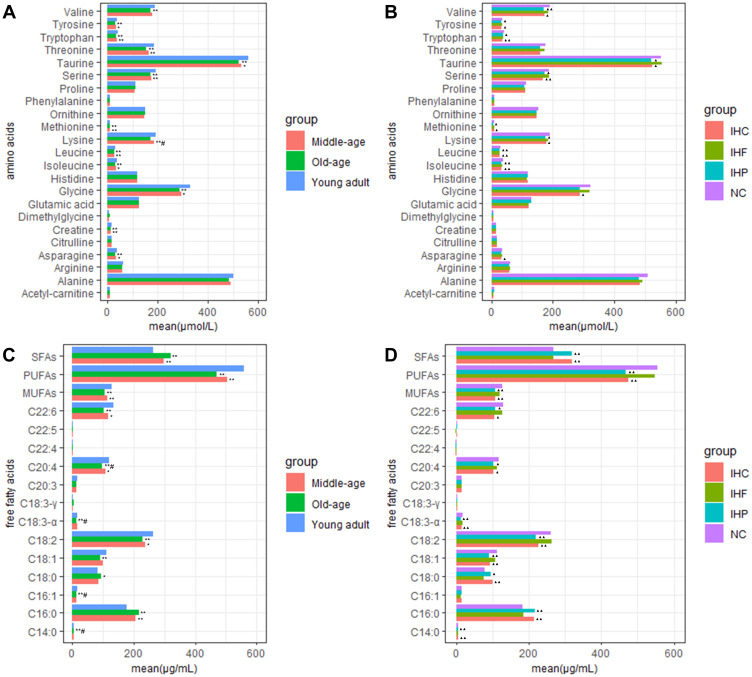
Figure 4.
One-way ANOVA followed by Dunnett post hoc test of different age groups and diet groups. (A) Comparison of amino acids concentrations in different age groups. (B) Comparison of amino acids concentration in different isocaloric dietary groups. (C) Comparison of free fatty acids concentrations in different age groups. (D) Comparison of free fatty acids concentrations in different isocaloric dietary groups. *P<0.05, **P<0.01 vs young adult group. #P<0.05 vs middle-age group. ▲P<0.05, ▲▲P<0.01 vs normal control group.
Abbreviations: NC, normal control group; IHP, isocaloric high-protein group; IHF, isocaloric high-fat group; IHC, isocaloric high-carbohydrate group.

