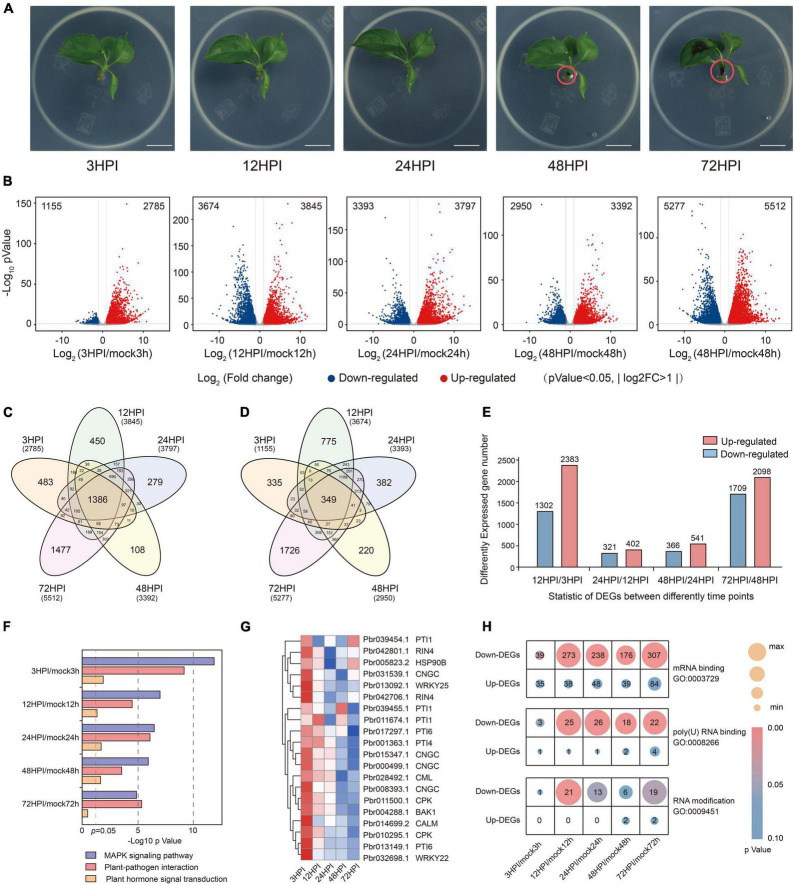
FIGURE 1.
Significant changes in transcription levels after fire blight inoculation. (A) Images of pear seedlings after fire blight inoculation at 3 HPI, 12 HPI, 24 HPI, 48 HPI, and 72 HPI. Scale bar = 1 cm. (B) Volcano plot of DEGs (differentially expressed genes) between Erwinia amylovora–inoculated and mock-inoculated at different time points. (C,D) Venn diagram showing the number of DGEs identified between Erwinia amylovora–inoculated and mock-inoculated at different time points. (C) Upregulation. (D) Downregulation. (E) The bars indicate the number of DEGs between samples from adjacent time points, red indicates upregulation, and blue indicates downregulation. (F) KEGG pathway analysis of upregulated genes in plant hormone signal transduction, plant–pathogen interaction, and MAPK signaling pathway. (G) Expression profiles of DEGs related with plant–pathogen interaction pathway. (H) Gene number of DEGs involved in GO term mRNA binding (GO:0003723), poly(U) RNA binding (GO:0008266), and RNA modification (GO: 0009451).

