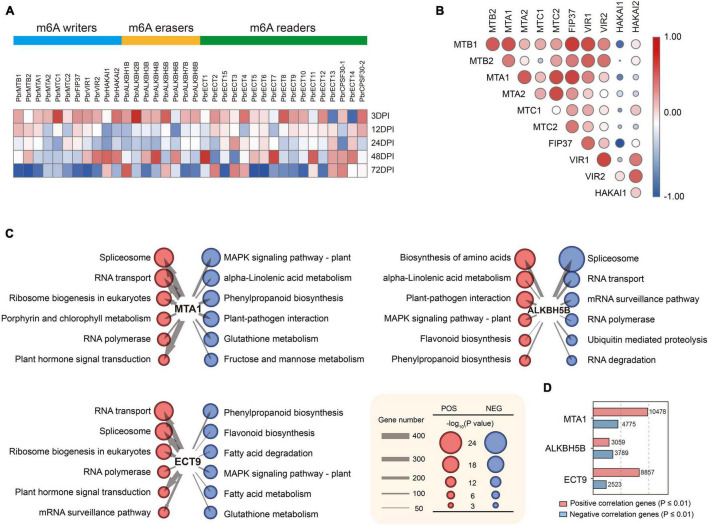
FIGURE 2.
Expression alterations of m6A writers, erasers, and readers in pear after fire blight inoculation. (A) Heat map of RNA-Seq expression of m6A regulators. Color scale of the dendrogram represents the scale value of TPM, normalized expression data expressed as log2 (TPM+1) values. (B) Correlation among the expression of m6A regulators. (C) Network diagram demonstrating the correlation between m6A regulators and signaling pathways. Red represents a positive correlation, and blue represents a negative correlation. The size of the nodes corresponds to the number of genes enriched in the entry. The size of the circles corresponds to -log10(p-value) of KEGG pathways. (D) Number of genes that significantly correlated with MTA1, ALKBH5B, and ECT9.

