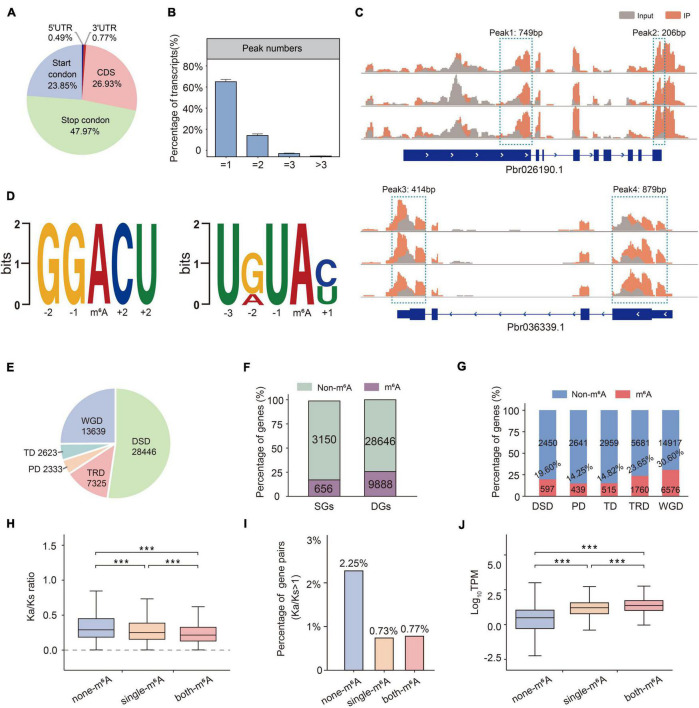
FIGURE 4.
Overview of m6A methylation profiles in pear. (A) Percentage of total m6A peaks located throughout the regions of mRNA transcript. (B) Proportions of different m6A peak numbers in m6A-modified transcripts. Error bars represent the SD of three biological repeats. (C) Two examples of m6A-modified transcripts each containing two peaks at start codon, stop codon, and CDS (coding sequence). (D) Sequence motif identified by MEME. (E) The number of gene pairs derived from five duplication types in pear. (F) Comparison of ratios of m6A genes and non-m6A genes in SGs and DGs. (G) Comparison of ratios of m6A genes and non-m6A genes in five duplication S types. (H) Ka/Ks ratio of non-m6A gene pairs (blue box), single gene pairs (orange box), and both-m6A gene pairs (red box) in WGD. (I) The percentages of gene pairs showing Ka/Ks> 1 in WGD. (J) Expression divergence among duplicate genes derived from non-m6A, single-m6A, and both-m6A in WGD.

