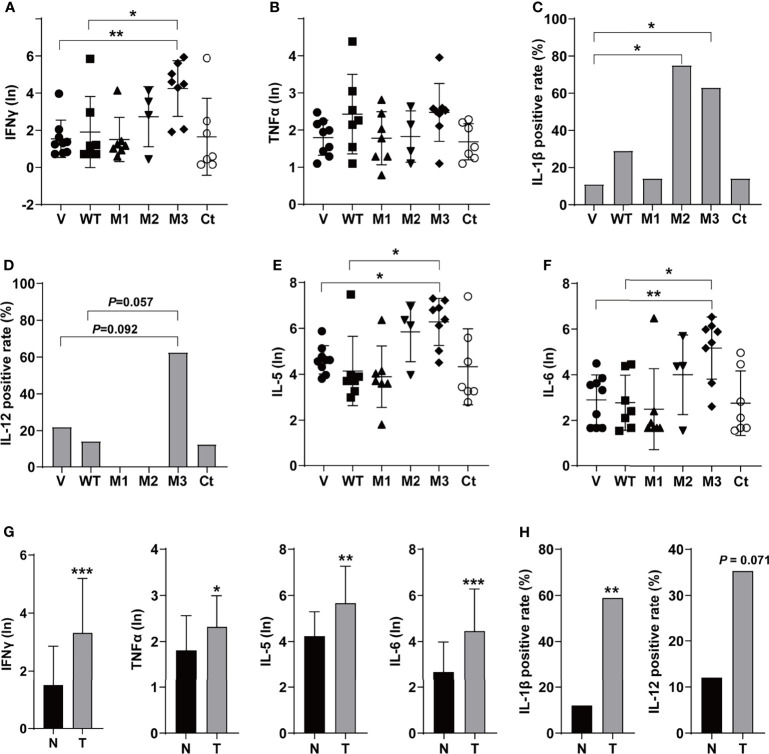
Figure 3.
The serum levels and the positive rates of cytokines in the SB mouse models. (A) The serum level of IFN-γ; (B) the serum level of TNF-α; (C) the positive rate of IL-1β; (D) the positive rate of IL-12; (E) the serum level of IL-5; (F) the serum level of IL-6; (G) the serum levels of IFN-γ, TNF-α, IL-5, and IL-6 in the mouse models with or without tumor; and (H) the positive rates of IL-1β and IL-12 in the mouse models with or without tumor. N, the tumor-free mice; T, the mice with tumors. *P < 0.05; **P < 0.01; ***P < 0.001.

