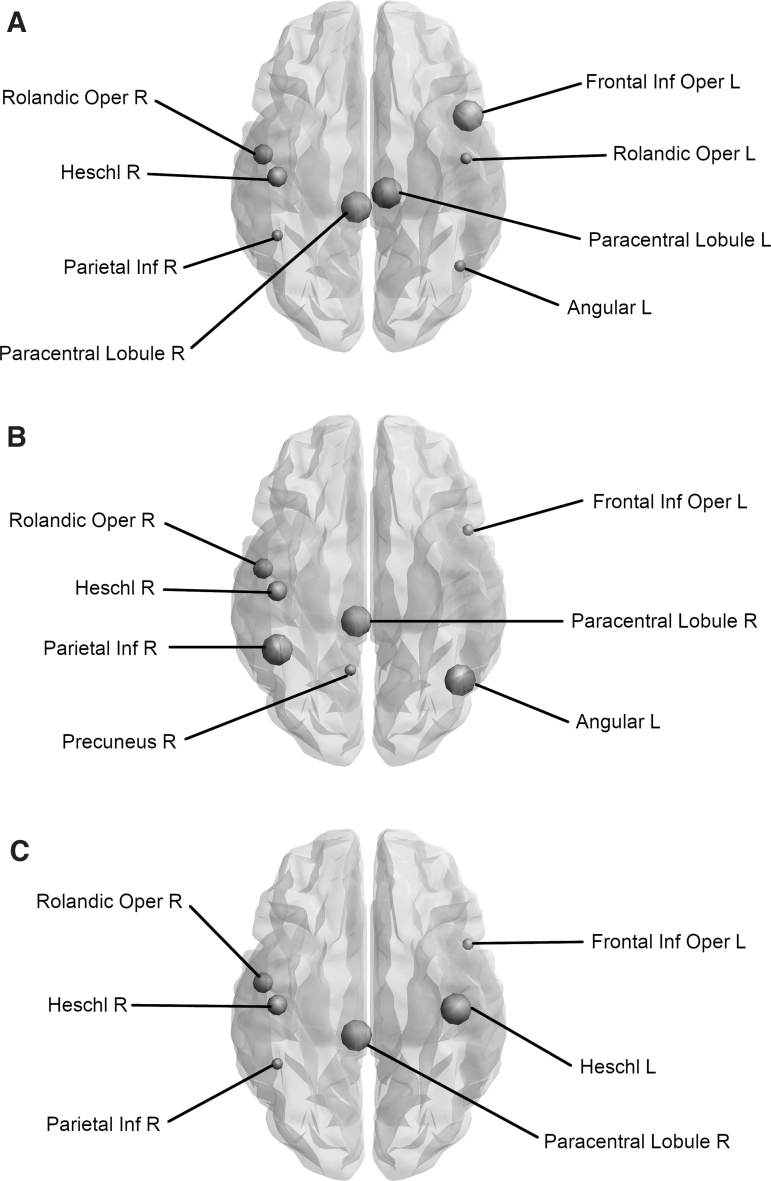
FIG. 4.
Nodes identified as hubs, change dependent on risk factor profile. This figure shows the changes in nodes defined as hub regions, when you transition from a low-risk group to a high-risk group. A size scale is used to define hub changes, large symbols indicate gained hubs whereas small symbols represent those hubs which are lost. The intermediate size indicates hubs that remain. (A) Comparing individuals without an FH with those with a positive FH indicates that two hubs remain unchanged, whereas three are gained and three are lost. (B) Comparing APOE4 noncarriers with carriers results in a gain of three hubs, loss of two hubs, but leaves two hubs unchanged. (C) In comparison with healthy individuals, obese participants gained two hubs, lost two hubs, and two hubs remain APOE4, apolipoprotein-E ɛ4; FH, family history of dementia.

