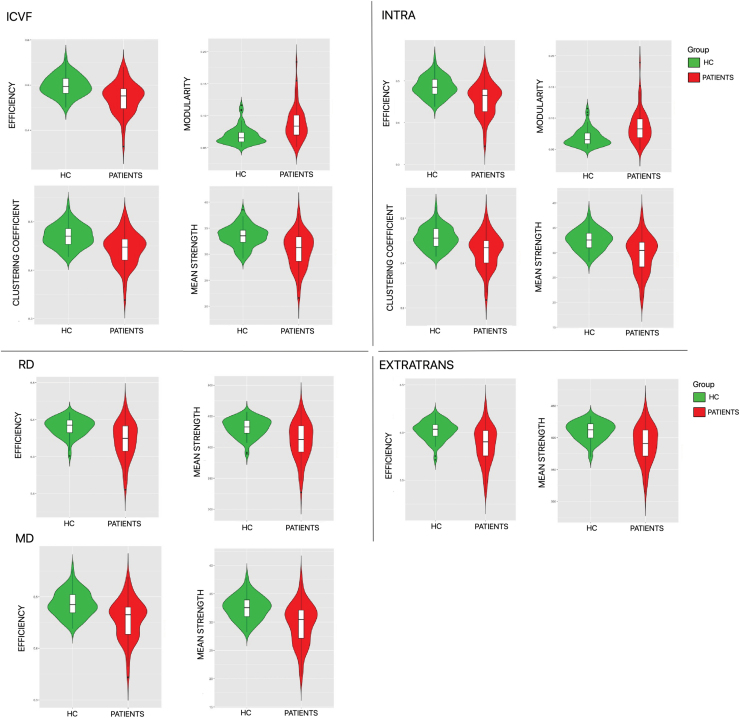
FIG. 3.
Violin plots of the metrics showing statistically significant differences between HCs (in green) and multiple sclerosis patients (in red). In the upper part of the violin plots, we show the efficiency, modularity, clustering coefficient, and mean strength resulting from the connectomes weighted using ICVF and INTRA. In the bottom part, we show efficiency and mean strength resulting from the connectomes weighted using RD, EXTRATRANS, and MD. EXTRATRANS, extraneurite transverse diffusivity; HC, healthy controls; ICVF, intraneurite volume fraction; INTRA, neurite volume fraction; MD, mean diffusivity; RD, radial diffusivity. Color images are available online.

