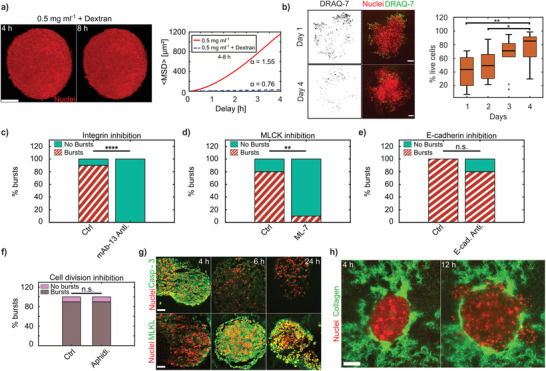
Figure 3.

Coordinated pressure‐driven cell dispersal depends on cell–ECM interactions and is independent of cell–cell adhesion and proliferation. a) Dextran pressure of 18 kPa in LCC stops bursts from the aggregates, scale bar = 100 µm. 〈MSD〉 between 4–8 hpe displaying subdiffusive behavior in LCC + dextran (N = 1) and super‐diffusion in LCC (N = 10). b) HeLa H2B‐mCherry aggregates stained for DRAQ‐7 (green) on days 1 and 4 (left) post embedding. Percentage of cells alive from days 1 to 4 (N = 10 each). Medians indicated, scale bars = 100 µm. c) Percentage of bursts in control (Ctrl (N = 10), LCC) as compared to in the presence of anti‐integrin antibody (mAb‐13 Anti. (N = 10), 30 µg mL−1) to inhibit integrin‐based cell–ECM adhesions. Bursts were checked at 8 hpe. d) Percentage of bursts in control (Ctrl (N = 10), LCC) as compared with the presence of drug (ML‐7 (N = 10), 100 µm) to inhibit MLCK. e) Percentage of bursts in control (Ctrl (N = 3), LCC) as compared with the presence of anti‐E‐cadherin antibody G‐10 (E‐cad. Anti. (N = 10) to inhibit cell–cell adhesion, 10µg mL−1). f) Percentage bursts in control (Ctrl, N = 10) and with aphidicolin (Aphidi. N = 10, 5 µg mL−1). All scenarios in (d–f) were checked for bursts at day 1 post embedding. g) 12 µm cryosections of aggregates stained for caspase‐3 and MLKL antibodies at 4, 6, and 24 h, scale bars = 50 µm. h) Collagen pockets in LCC seen at 4 and 12 hpe, scale bar =100µm.
