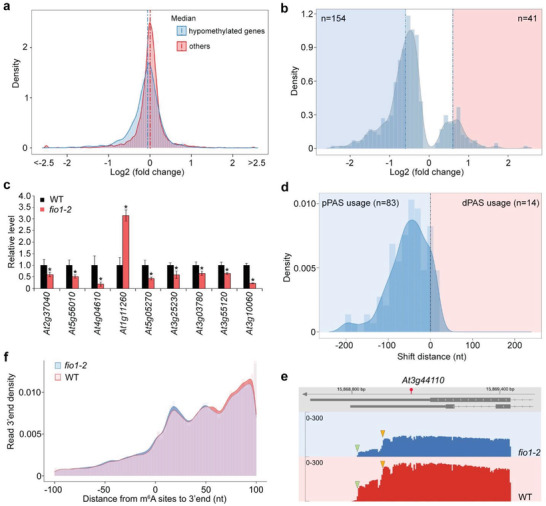
Figure 3.

FIO1 regulates transcript abundance and alternative polyadenylation. a) Distribution of changes in gene expression between fio1‐2 and wild‐type plants for hypomethylated genes and other genes (P < 10 × 10−16, two sided Mann–Whitney test). b) Distribution of differentially expressed genes with hypomethylated sites in fio1‐2 compared with wild‐type seedlings (P < 0.05; log2 (fold change) > 0.6). c) Expression of several randomly chosen differentially expressed genes in fio1‐2 determined by real‐time PCR. Six‐day‐old wild‐type and fio1‐2 seedlings grown under long days were harvested for expression analysis. The expression levels of each gene in wild‐type seedlings were set as 1.0. Error bars, mean ± SD; n = 3 biological replicates. Asterisks indicate significant differences between fio1‐2 and wild‐type seedlings (two‐tailed paired Student's t‐test, P < 0.05). d) A shift to the usage of proximal 3′ end polyadenylation sites found in fio1‐2 compared with wild‐type. e) At3g44110, which is methylated in the 3′ UTR, shows a shift to the usage of the proximal polyadenylation site in fio1‐2. The position of the hypomethylated site is indicated by a red circle. Green and yellow triangles indicate the distal and proximal sites, respectively. f) Histogram showing the distance from the hypomethylated sites to the 3′ end of nanopore reads.
