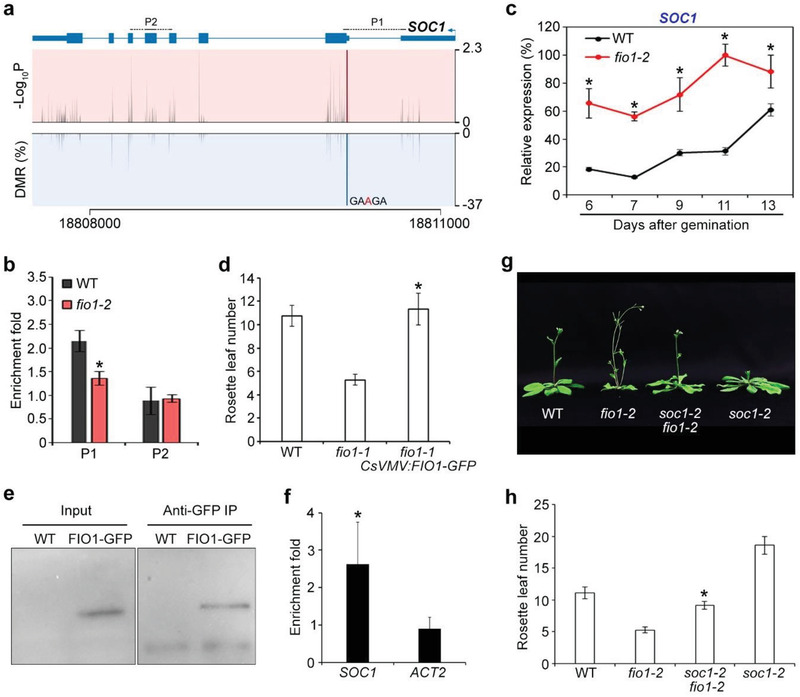
Figure 4.

FIO1‐mediated m6A methylation modulates SOC1 expression in flowering time control. a) Diagram showing the DMR, the corresponding P value, and the transcript sequence with an identified m6A site in SOC1 transcripts. The gene structure is shown above. Thick and thin boxes represent exons and UTRs, respectively, and lines represent introns. The sequences amplified by the primers are labeled above the gene structure. b) Verification of the nanopore direct RNA sequencing result for SOC1. m6A‐IP‐qPCR was performed with 6‐day‐old wild‐type and fio1‐2 seedlings. Error bars, mean ± SD; n = 3 biological replicates. Asterisk indicates a significant difference in m6A enrichment levels between fio1‐2 and wild‐type seedlings (two‐tailed paired Student's t‐test, P < 0.05). c) Temporal expression pattern of SOC1 in developing wild‐type and fio1‐2 seedlings. Wild‐type and fio1‐2 seedlings grown under long days were harvested for expression analysis. The expression levels were normalized to TUB2 expression and then normalized to the highest expression level set as 100%. Error bars, mean ± SD; n = 3 biological replicates. Asterisks indicate significant differences between fio1‐2 and wild‐type seedlings (two‐tailed paired Student's t‐test, P < 0.05). d) An fio1‐1 CsVMV:FIO1‐GFP transgenic line shows comparable flowering time to a wild‐type plant under long days. Error bars, mean ± SD; n = 15. Asterisk indicates a significant difference in the flowering time between fio1‐1 CsVMV:FIO1‐GFP and fio1‐1 (two‐tailed paired Student's t‐test, P < 0.05). e) FIO1‐GFP can be detected and immunoprecipitated by anti‐GFP antibodies. Six‐day‐old wild‐type and CsVMV:FIO1‐GFP seedlings were harvested for analysis. Western blot was performed with the input and immunoprecipitated (IP) samples using anti‐GFP antibody. f) RNA immunoprecipitation assay reveals the direct binding of FIO1‐GFP to SOC1 transcripts. Six‐day‐old wild‐type and fio1‐1 CsVMV:FIO1‐GFP seedlings grown under long days were harvested for RNA immunoprecipitation assay. Enrichment of ACTIN2 (ACT2) was included as a negative control. Error bars, mean ± SD; n = 3 biological replicates. Asterisk indicates a significant difference in FIO1‐GFP enrichment on SOC1 compared with the ACT2 negative control (two‐tailed paired Student's t‐test, P < 0.05). g) A soc1‐2 fio1‐2 double mutant flowers later than fio1‐2. h) Flowering time of soc1‐2 fio1‐2 under long days. Error bars, mean ± SD; n = 15 plants. Asterisk indicates a significant difference in the flowering time between soc1‐2 fio1‐2 and fio1‐2 (two‐tailed paired Student's t‐test, P < 0.05).
