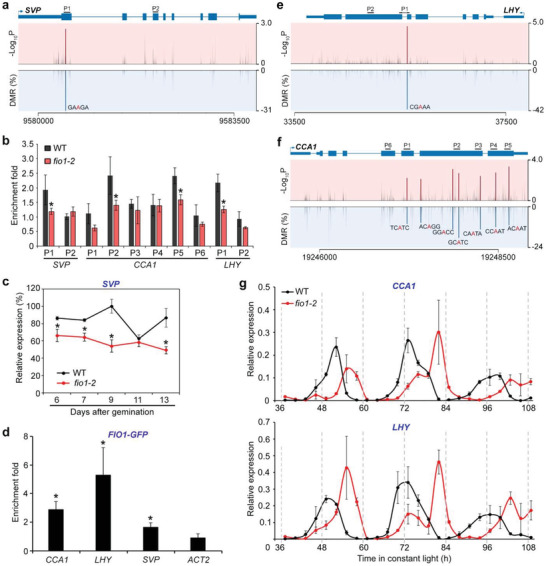
Figure 5.

FIO1‐mediated m6A methylation modulates the expression pattern of genes acting upstream of SOC1. a) Schematic diagrams showing the DMRs, the corresponding P value, and the transcript sequence with an identified m6A site in SVP transcripts. The gene structure is shown above. Thick and thin boxes represent exons and UTRs, respectively, and lines represent introns. The sequences amplified by the primers are labeled above the gene structure. b) Verification of the nanopore direct RNA sequencing results for several genes acting upstream of SOC1. m6A‐IP‐qPCR was performed with 6‐day‐old wild‐type and fio1‐2 seedlings. Error bars, mean ± SD; n = 3 biological replicates. Asterisks indicate significant differences in m6A enrichment levels between fio1‐2 and wild‐type seedlings (two‐tailed paired Student's t‐test, P < 0.05). c) Temporal expression pattern of SVP in developing wild‐type and fio1‐2 seedlings. Wild‐type and fio1‐2 seedlings grown under long days were harvested for expression analysis. The expression levels were normalized to TUB2 expression and then normalized to the highest expression level set as 100%. Error bars, mean ± SD; n = 3 biological replicates. Asterisks indicate significant differences between fio1‐2 and wild‐type seedlings (two‐tailed paired Student's t‐test, P < 0.05). d) RNA immunoprecipitation assay reveals the direct binding of FIO1‐GFP to the transcripts of SVP, CCA1, and LHY. Six‐day‐old wild‐type and fio1‐1 CsVMV:FIO1‐GFP seedlings grown under long days were harvested for RNA immunoprecipitation assay. Enrichment of ACT2 was included as a negative control. Error bars, mean ± SD; n = 3 biological replicates. Asterisks indicate significant differences in FIO1‐GFP enrichment on SVP, CCA1, and LHY compared with ACT2 (two‐tailed paired Student's t‐test, P < 0.05). Schematic diagrams showing the DMRs, corresponding P values, and the transcript sequences with the identified m6A sites in e) CCA1 and f) LHY transcripts. g) Disruption of fio1‐2 lengthens the cycling periods of CCA1 (upper panel) and LHY (lower panel). Wild‐type and fio1‐2 seedlings were first entrained with 12 h light/12 h dark photoperiods for 9 days before being shifted to the constant light conditions at ZT 0. The samples were collected at 3 h interval from ZT 37 for 3 days. Expression levels of CCA1 and LHY were determined by quantitative real‐time PCR and normalized to the expression of TUB2.
