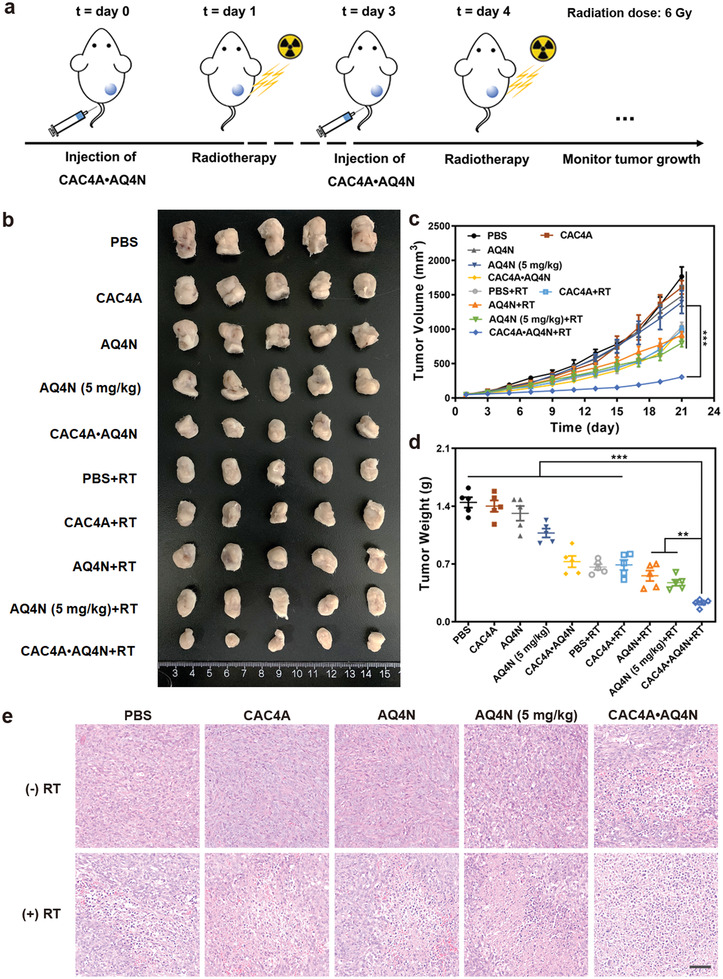
Figure 4.

Antitumor efficiency of CAC4A•AQ4N in vivo. a) Schematic illustration experiment design for radiotherapy. Radiation dose: 6 Gy. b) The image of tumors dissected from mice with different treatments. c) Tumor volume growth curves of mice treated with various interventions. d) Tumor weight changes of the mice after different treatments. e) H&E staining analysis of tumor sections from mice after various treatments. Scale bar, 50 µm. Data are presented as mean ± s.d. (n = 5). p‐values were calculated by ANOVA analysis: **p < 0.01, ***p < 0.001.
