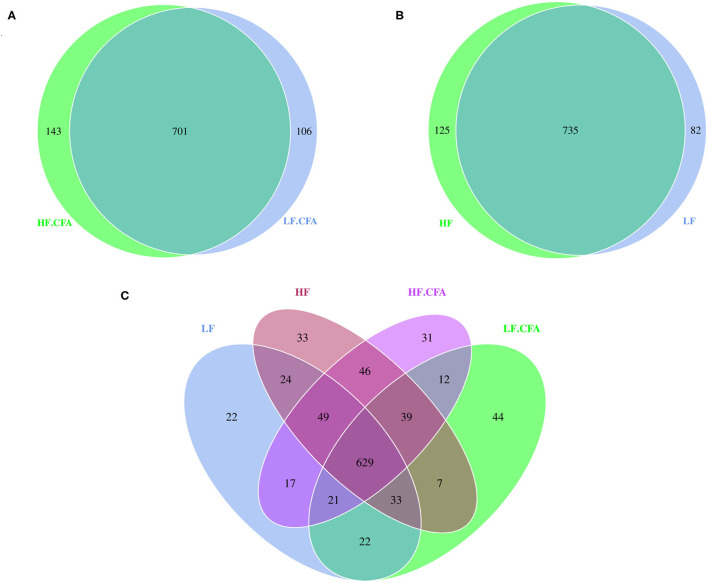
Figure 4.
Microbiota comparison of the OTUs among treatments in the colon. The observed OTUs sharing ≥97% sequence similarity. (A–C) Venn diagrams describe the common and unique OTUs among four groups, respectively, HF, High fiber, no CFA; LF, Low fiber, no CFA; HF.CFA, High fiber with CFA challenge; LF.CFA, Low fiber with CFA challenge.

