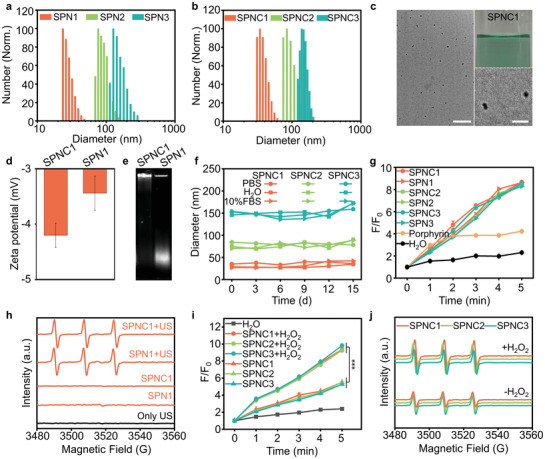
Figure 2.

In vitro characterization of SPNs and SPNCs. a) DLS profiles of SPN1, SPN2, and SPN3. b) DLS profiles of SPNC1, SPNC2, and SPNC3. c) Nanoparticle solutions (25 µg mL–1) and TEM images of SPNC1. Scale bar (left) = 200 nm. Scale bar (right) = 50 nm. d) Zeta potential of SPN1 and SPNC1. e) Agarose gel electrophoresis of SPNC1 and SPN1. f) Hydrodynamic diameter stability of SPNC1, SPNC2, and SPNC3 after different days in 1× phosphate buffer solution (PBS), H2O, and PBS containing 10% serum. g) 1O2 generation of porphyrin, SPNs, and SPNCs after different times of US irradiation (50 kHz, 1 W cm–2, 50% duty cycle) measured by fluorescence intensity enhancement (F/F0) of SOSG. h) 1O2 generation of SPN1 and SPNC1 with or without US irradiation (50 kHz, 1 W cm–2, 50% duty cycle) measured by ESR spectra. i) 1O2 generation of SPNCs measured by fluorescence intensity enhancement (F/F0) of SOSG under the hypoxic environment in the presence or absence of H2O2 (50 × 10−6 m). j) 1O2 generation of SPNCs measured by ESR spectra under hypoxia environment in the presence or absence of H2O2 (50 × 10−6 m). Error bars represent the standard deviations of three separate measurements (n = 3). ***p < 0.001.
