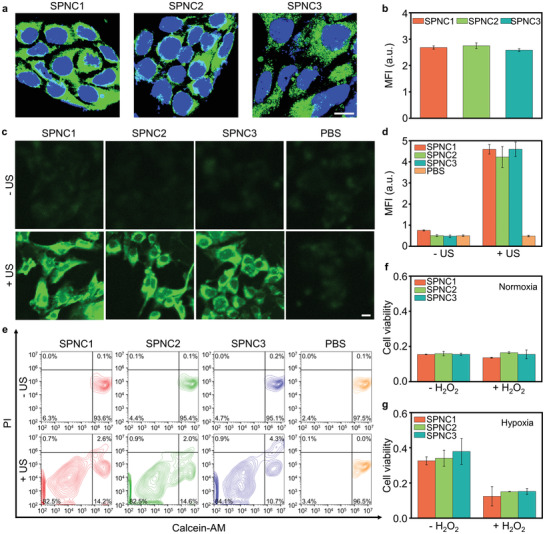
Figure 3.

In vitro studies of sonodynamic therapy. a) Confocal fluorescence images and b) mean fluorescence intensity (MFI) of 4T1 cancer cells after incubation with SPNC1, SPNC2, and SPNC3 (25 µg mL–1) for 4 h. Blue fluorescence indicated the cell nucleus, and the green fluorescence indicated the signal from BODIPY doped SPNCs. Scale bar = 10 µm. c) Confocal fluorescence images and d) MFI of 4T1 cancer cells after incubation with SPNC1, SPNC2, and SPNC3 (25 µg mL–1) for 4 h, followed by staining with DCFH‐DA with or without US irradiation (50 kHz, 1 W cm–2, 50% duty cycle) for 1 min. Scale bar = 10 µm. e) Flow cytometry quantification assay of 4T1 cancer cells incubated with SPNC1, SPNC2, and SPNC3 (25 µg mL–1) for 4 h with or without US irradiation (50 kHz, 1 W cm–2, 50% duty cycle) for 1 min. The cells were stained with calcein‐AM and propidium iodide (PI). Relative cell viability of 4T1 cancer cells after incubation with SPNC1, SPNC2, and SPNC3 (25 µg mL–1) with US irradiation (50 kHz, 1 W cm–2, 50% duty cycle) under f) normoxic or g) hypoxic environment in the presence or absence of H2O2(50 × 10−6 m). Error bars represent the standard deviations of three separate measurements (n = 3).
