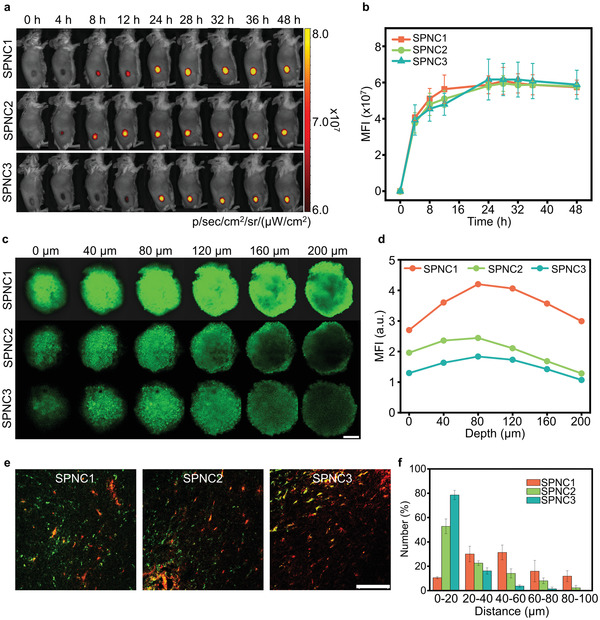
Figure 4.

In vivo fluorescence imaging and size‐dependent tumor penetration ability of SPNCs. a) Fluorescence images and b) MFI of tumor sites of 4T1 tumor‐bearing living mice at different time points after intravenous injection of NCBS‐doped SPNC1, SPNC2, and SPNC3 (0.2 mL, 200 µg mL–1). c) Z‐stack CLSM images of 4T1 3D MCTs incubated with BODIPY‐doped SPNC1, SPNC2, and SPNC3 for 12 h (25 µg mL–1). Scale bar = 200 µm. d) Fluorescence intensity of 4T1 3D MCTs at different depths. e) In vivo penetration behaviors of SPNC1, SPNC2, and SPNC3 in tumor sites of 4T1 tumor‐bearing living mice after 24 h intravenous injection of nanoparticles. Green fluorescence indicated the location of nanoparticles and red fluorescence indicated the location of blood vessels. Scale bar = 100 µm. f) Semi‐quantitative analysis of the distance between nanoparticles and tumor blood vessels after 24 h intravenous injection of nanoparticles. Error bars represent the standard deviations of three separate measurements (n = 3).
