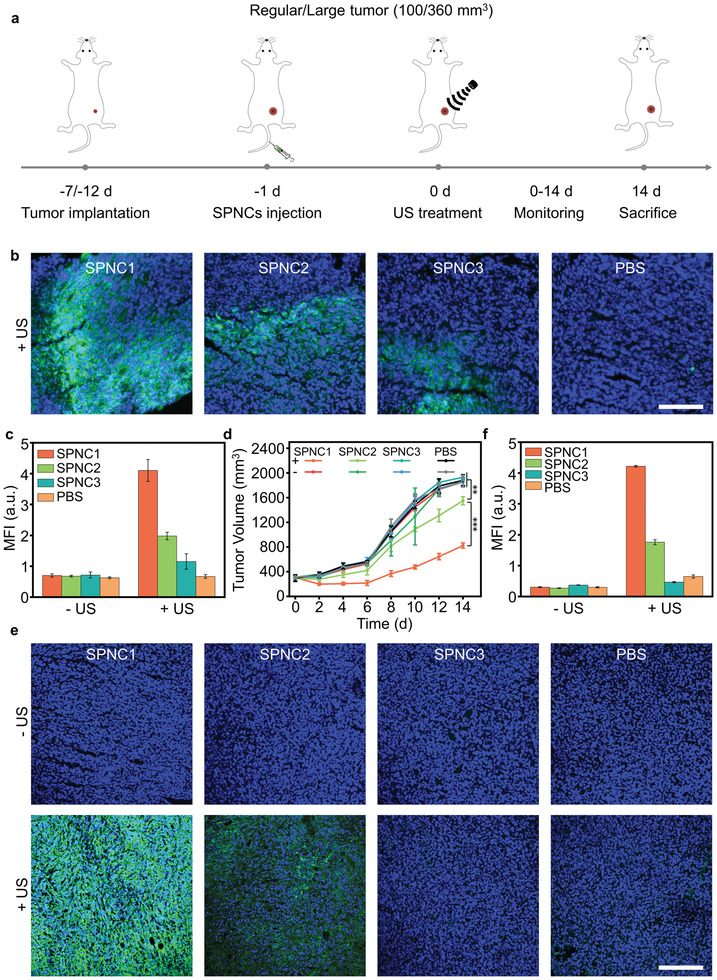
Figure 6.

a) Schematic illustration of the timeline for tumor model implantation with different tumor sizes and SPNCs‐mediated sonodynamic therapy in the regular and large tumor models. b) Confocal fluorescence images and c) MFI of tumors from the large 4T1 tumor‐bearing mice after intravenous injection of SPNC1, SPNC2, SPNC3, and PBS treated with SOSG in the presence of US irradiation. Blue fluorescence indicated the cell nucleus, and the green fluorescence indicated the signal from SOSG. Scale bar = 100 µm. d) Tumor growth curves of different groups of mice in the large tumor model after systemic treatment with PBS, SPNC1, SPNC2, or SPNC3 in the presence or absence of US irradiation. e) Immunofluorescence staining and f) MFI of caspase‐3 of tumors from large 4T1 tumor‐bearing mice after intravenous injection of SPNC1, SPNC2, SPNC3, and PBS in the presence or absence of US irradiation. Blue fluorescence indicated the cell nucleus, and the green fluorescence indicated the signal from anti caspase‐3 antibody. Scale bar = 100 µm. Error bars represent the standard deviations of three separate measurements (n = 5). **p < 0.01 and ***p < 0.001.
