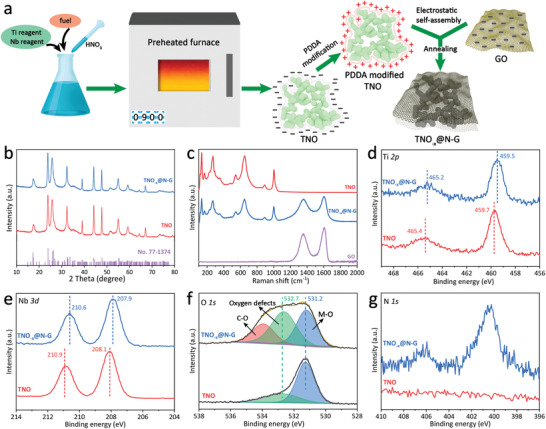
Figure 1.

a) Schematic illustration of the synthesis of the TNO− x @N‐G. b) XRD patterns of the TNO and TNO− x @N‐G. c) Raman spectra of the TNO, TNO− x @N‐G and GO. d–g) High‐resolution XPS spectra of the TNO and TNO− x @N‐G: d) Ti 2p, e) Nb 3d, f) O 1s, and g) N 1s.
