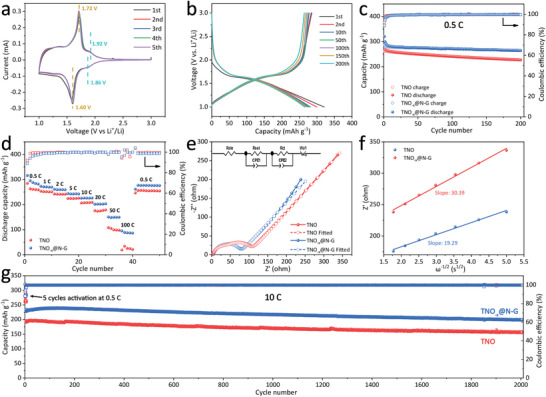
Figure 3.

a) CV curves of the TNO− x @N‐G electrode for the first five cycles. b) Typical charge and discharge profiles of the TNO− x @N‐G at 0.5 C. c) Cycling performance of the TNO and TNO− x @N‐G at 0.5 C. d) Rate performance of the TNO and TNO− x @N‐G. e) EIS of the TNO and TNO− x @N‐G electrodes. f) Dependence of the real impedance (Z) on the reciprocal of the square root of the frequency (υ −1/2) for determination of the Warburg coefficient (σ). g) Long‐term cycling performance of the TNO and TNO− x @N‐G at 10 C.
