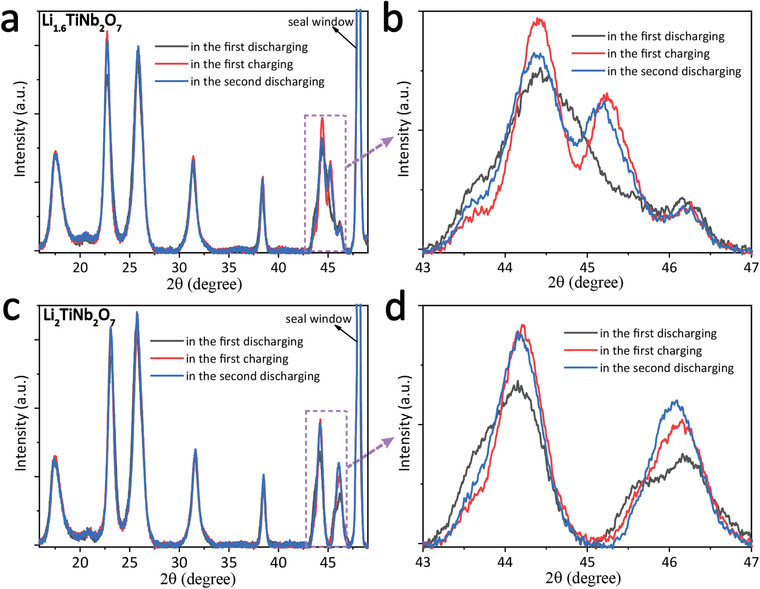
Figure 5.

Ex situ XRD patterns of Li y TiNb2O7 for a) y = 1.6 and c) y = 2.0 in the first discharging, the first charging, and the second charging processes. The green dashed rectangles indicate the same 2θ angle range with that indicated by the red dashed rectangles in Figure 4b. (b) and (d) correspond to the purple dashed rectangles in (a) and (c).
