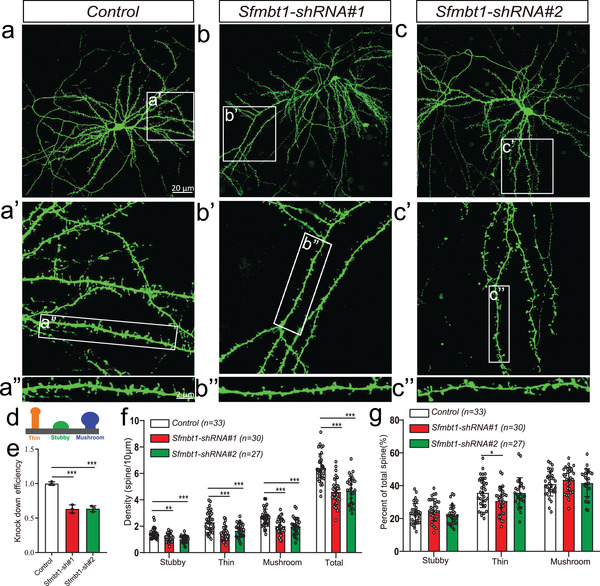
Figure 8.

Sfmbt1 knockdown affected the density and proportion of the dendritic spines. a–c) Confocal images of whole neurons transfected with control and Sfmbt1 knockdown vectors (scale bars represent 20 µm). Dendritic branches were captured from each corresponding neuron, respectively (scale bars represent 2 µm). Green fluorescence is the result of immunofluorescence of GFP protein expressed by co‐transfected GFP vector. d) A schematic diagram to show different types of spines. e) Relative expression of Sfmbt1 in control and Sfmbt1 knocked‐down neurons (measured by real‐time qPCR). (n = 3). f) Density analysis of each dendritic spine subtype. g) Percentage analysis of each dendritic spine subtype. n = 33 for control group, n = 30 for shRNA#1 group, and n = 27 for shRNA#2 group. P values were calculated using the Student's t‐test (two‐tailed) in (e–g). *P < 0.05, **P <0.01, ***P < 0.001.
