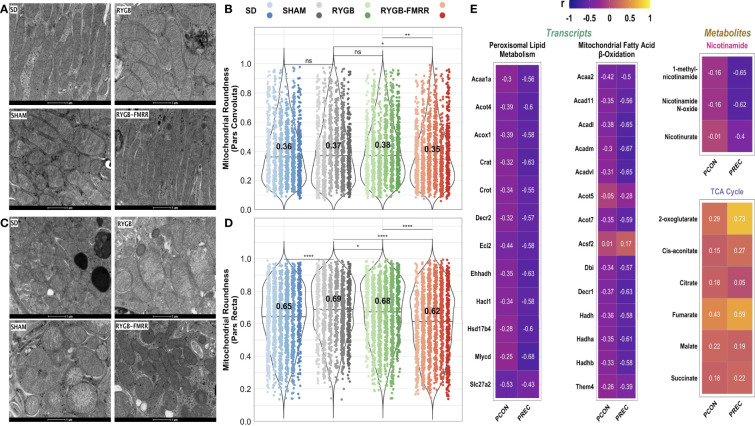
Figure 10.
Changes in proximal tubular mitochondrial roundness and their relationship to renal cortical FAO transcripts and urinary nicotinamide and TCA cycle metabolites. (A, C) Representative images (16500x, scale bar 1µm) of transmission electron microscopy images of mitochondria in the pars convoluta (A) and pars recta (C) regions of the proximal tubule from the four experimental groups. (B, D) Mitochondrial roundness in the pars convoluta (B) and pars recta (D) was quantified using transmission electron microscopy images from 6 animals per group. Mitochondria were quantified in 15 non-overlapping images captured from 3 distinct pars convoluta and pars recta regions (5 images/region) for each animal. Data are plotted as violin plots with individual mitochondrial measurements superimposed. Within each group, each animal is identified as its own column of dots with a unique colour shade. Median group values are identified by the horizontal black line in each violin and printed on each violin. Statistical significance of between-group differences derived from multiplicity-corrected Wilcoxon rank-sum tests is presented. Statistical significance is denoted as follows: ns = not significant; * = p <0.05; ** = p <0.01; *** = p <0.001; **** = p <0.0001. (E) Correlation plots highlighting Pearson correlation r values for mitochondrial roundness (pars convoluta and pars recta) correlations with renal cortical transcripts and urinary metabolites. Regularized log-transformed gene expression counts were used for gene-structure correlations. Transcripts plotted are those which resulted in enrichment of peroxisomal and mitochondrial lipid metabolism pathways in RYGB-FMRR rats (also highlighted in the circular network plot in Figure 2D ). PQN-normalized urinary 1H-NMR peaks from samples obtained at 4 weeks after intervention were used for metabolite-structure correlations. Metabolites involved in nicotinamide metabolism (PPARα biomarkers) and TCA cycle intermediates, many of which were differentially abundant between RYGB-FMRR and RYGB rats, are plotted. Individual cells in the correlation plots are scaled by colour indicating strength and directionality of the correlation. PCON, pars convoluta; PPARα, peroxisome proliferator-activated receptor-alpha; PREC, pars recta; RYGB, Roux-en-Y gastric bypass; RYGB-FMRR, Roux-en-Y gastric bypass plus fenofibrate, metformin, ramipril, and rosuvastatin; SD, Sprague Dawley; SHAM, sham surgery (laparotomy); TCA, tricarboxylic acid.

