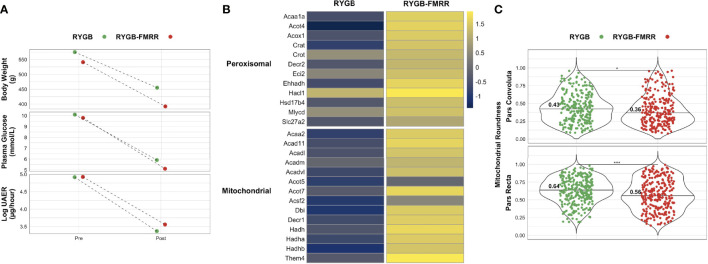
Figure 11.
Comparison of renal cortical lipid metabolism parameters between RYGB and RYGB-FMRR rats matched for improvements in metabolic control and urinary albumin excretion. (A) One rat each from the RYGB and RYGB-FMRR groups, matched for body weight, plasma glucose, and albuminuria, was used for a comparative analysis of renal cortical lipid metabolism transcript expression and proximal tubular mitochondrial morphology. Body weight, plasma glucose, and log urinary albumin excretion rate values pre- and post-intervention are plotted, highlighting both similar baseline values and magnitude of improvement in these parameters for each rat from the RYGB and RYGB-FMRR groups. (B) Heatmap of renal cortical peroxisomal and mitochondrial lipid metabolism transcript expression for the matched RYGB and RYGB-FMRR rats, indicating increased relative expression of lipid metabolism transcripts in the RYGB-FMRR rat. Regularized log-transformed gene expression counts from RNA-sequencing, centred and scaled by row, are plotted. Transcripts plotted are those which resulted in enrichment of peroxisomal and mitochondrial lipid metabolism pathways in RYGB-FMRR rats (also highlighted in the circular network plot in Figure 2D ). Heatmap rows display individual transcripts while columns reflect values from the matched RYGB and RYGB-FMRR rats. The column gap separates RYGB and RYGB-FMRR rats, while the row gap separates peroxisomal and mitochondrial lipid metabolism transcripts. (C) Mitochondrial roundening was lower in both the pars convoluta and pars recta sections of the proximal tubule in the RYGB-FMRR animal compared with the matched RYGB animal. Mitochondrial roundness in the pars convoluta and pars recta was quantified using transmission electron microscopy images from each of the matched animals. Mitochondria were quantified in 15 non-overlapping images captured from 3 distinct pars convoluta and pars recta regions (5 images/region) for each animal. Data are plotted as violin plots with individual mitochondrial measurements superimposed. Median values are identified by the horizontal black line in each violin and printed on each violin. Statistical significance of differences in mitochondrial characteristics between the two animals derived from Wilcoxon rank-sum tests is denoted as follows: ns = not significant; * = p <0.05; ** = p <0.01; *** = p <0.001; **** = p <0.0001. RYGB, Roux-en-Y gastric bypass; RYGB-FMRR, Roux-en-Y gastric bypass plus fenofibrate, metformin, ramipril, and rosuvastatin; UAER, urinary albumin excretion rate.

