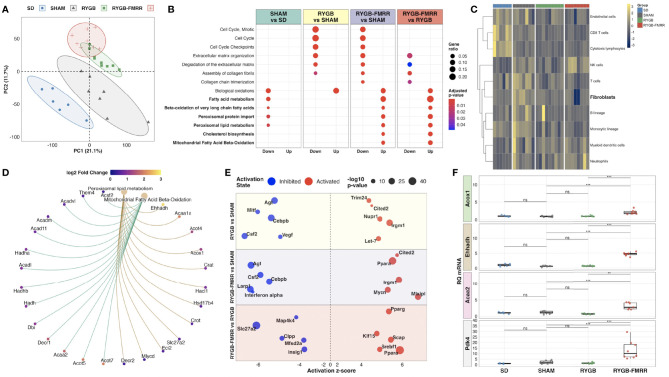
Figure 2.
Characterization of renal cortical transcriptomic changes across the experimental groups. (A) Principal component analysis of regularized log-transformed gene expression counts demonstrates renal cortical transcriptomic differences according to group assignment. (B) Dotplot of Reactome pathway over-representation analysis illustrating pathways commonly changed by both RYGB and RYGB-FMRR, and those uniquely changed by RYGB-FMRR (50). Dot colour represents the adjusted p-value for pathway enrichment while dot size is scaled by the gene ratio. Pathways pertaining to fatty acid metabolism are bolded. (C) Heatmap visualization of abundance estimates of eight immune and two stromal cell populations obtained using the Microenvironment Cell Populations-counter (MCP-counter) R package (54). Cell abundance estimates were centred and scaled by heatmap row. Each heatmap row displays abundance of a different cell population. Heatmap columns correspond to individual rats. Gaps between columns as well as the column annotations demarcate the four experimental groups from left to right: SD (blue), SHAM (grey), RYGB (green), and RYGB-FMRR (red). Colouring of heatmap cells reflects relative cell abundance between rats: navy = low relative abundance, yellow = high relative abundance. (D) Circular network plot of two fatty acid metabolism pathways uniquely changed by RYGB-FMRR (51). Pathways are represented by the brown nodes at the top of the network. Gene nodes are connected to the brown pathway nodes by coloured edges (gold = peroxisomal; green = mitochondrial). Individual gene nodes are coloured according to magnitude of log2 fold change in transcript abundance in the RYGB-FMRR group relative to the RYGB group. (E) Bubble plot of predicted upstream regulators of gene expression changes (Ingenuity Pathway Analysis) (52). Upstream regulator changes are presented for 3 comparisons: RYGB vs SHAM, RYGB-FMRR vs SHAM, and RYGB-FMRR vs RYGB. The predicted status (inhibited or activated) of upstream regulators is plotted according to z-score. Dot size is scaled to reflect the statistical significance of z-score changes. (F) Quantitative reverse-transcription PCR validation of renal cortical expression changes in three PPARα-responsive transcripts, both peroxisomal (Acox1, Ehhadh) and mitochondrial (Acaa2), as well as the mitochondrial enzyme Pdk4, which is a sensitive transcriptional marker of FAO induction. The full data range in each group is captured in boxplots, with gene expression levels of individual constituent samples superimposed. Statistical significance of between-group differences derived from multiplicity-corrected Wilcoxon rank-sum tests is presented. Statistical significance is denoted as follows: ns = not significant; * = p <0.05; ** = p <0.01; *** = p <0.001; **** = p <0.0001. Acaa2, acetyl-Coenzyme A acyltransferase 2; Acox1, acyl-CoA oxidase 1; Ehhadh, enoyl-CoA hydratase and 3-hydroxyacyl CoA dehydrogenase; PC, principal component; Pdk4, pyruvate dehydrogenase kinase 4; RQ mRNA, relative quantification of messenger ribonucleic acid; RYGB, Roux-en-Y gastric bypass; RYGB-FMRR, Roux-en-Y gastric bypass plus fenofibrate, metformin, ramipril, and rosuvastatin; SD, Sprague Dawley; SHAM, sham surgery (laparotomy).

