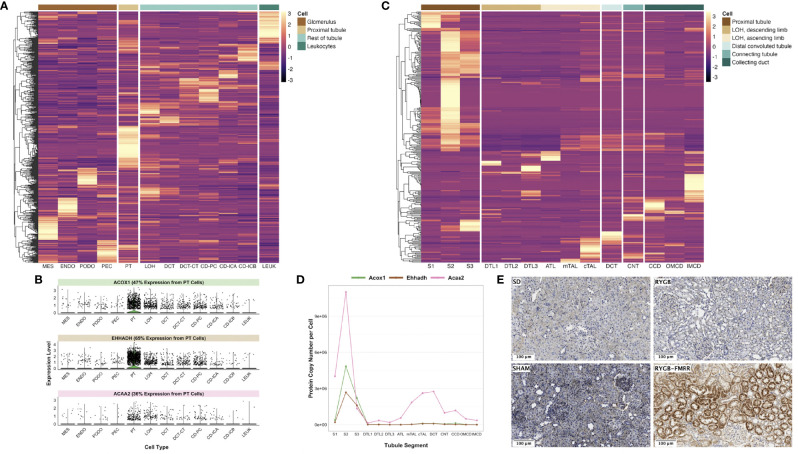
Figure 3.
In silico deconvolution of the predicted cellular source of transcripts differentially expressed between the RYGB-FMRR and RYGB groups. (A) Transcripts identified in the RYGB-FMRR versus RYGB differential expression analysis were intersected with a human diabetic kidney single-nucleus RNA-sequencing dataset (56). Transcript expression levels in the human diabetic kidney, averaged across cell types by the Seurat function ‘AverageExpression’ and subsequently centred and scaled by row, are plotted on the heatmap. Heatmap rows display the differentially regulated transcripts whilst each column represents 1 of 12 identified renal cell types. Cell groupings of individual cell types in the heatmap columns are indicated in the legend key. An increasingly light colour in a specific cell type reflects an increased relative expression therein relative to other cell types. (B) Violin plots of cell-specific expression in the human diabetic kidney of three PPARα-responsive transcripts upregulated by RYGB-FMRR. Kidney cell types are presented on the x-axis with relative transcript expression levels in the human diabetic kidney on the y-axis. Each dot represents a single cell in the human diabetic kidney. The proportion of expression of each transcript by proximal tubular cells as a proportion of all cells identified in the single-nucleus RNA-sequencing dataset is indicated. (C) Transcripts identified in the RYGB-FMRR versus RYGB differential expression analysis were intersected with a proteomics dataset of microdissected Sprague Dawley rat kidney tubules (https://esbl.nhlbi.nih.gov/KTEA/) (58). Protein expression (copy number per cell) in rat tubular epithelial cells is plotted on the heatmap, after centering and scaling by row. Heatmap rows display the differentially regulated transcripts between RYGB-FMRR and RYGB whilst each column represents 1 of 14 rat tubular epithelial cell types. Cell groupings of individual cell types in the heatmap columns are indicated in the legend key. An increasingly light colour in a specific cell type reflects an increased relative expression therein relative to other cell types. (D) Line plots of cell-specific expression in rat tubular epithelial cells of three PPARα-responsive transcripts upregulated by RYGB-FMRR. Tubular epithelial cell types are presented on the x-axis with protein expression (copy number per cell) in rat tubular epithelial cells on the y-axis. (E) Representative images (20x, scale bar 100µm) of kidney immunohistochemical ACOX1 staining across the four experimental groups, validating the proximal tubular localisation of ACOX1 as well as its induction in rats treated with RYGB-FMRR. ACAA2, acetyl-coenzyme A acyltransferase 2; ACOX1, acyl-CoA oxidase 1; ATL, ascending thin limb of Henle’s loop; CCD, cortical collecting duct; CD-ICA, collecting duct-intercalated cell type A; CD-ICB, collecting duct-intercalated cell type B; CD-PC, collecting duct-principal cell; CNT, connecting tubule; cTAL, cortical thick ascending limb; DCT, distal convoluted tubule; DCT-CT, distal convoluted tubule-connecting tubule; DTL1, descending thin limb of Henle’s loop, short-loop; DTL2, descending thin limb of Henle’s loop, long-loop, outer medulla; DTL3, descending thin limb of Henle’s loop, long-loop, inner medulla; ENDO, endothelial cell; EHHADH, enoyl-CoA hydratase and 3-hydroxyacyl CoA dehydrogenase; IMCD, inner medullary collecting duct; LEUK, leukocytes; LOH, loop of Henle; MES, mesangial cell; mTAL, medullary thick ascending limb; OMCD, outer medullary collecting duct; PEC, parietal epithelial cell; PODO, podocyte; PPARα, peroxisome proliferator-activated receptor-alpha; PT, proximal tubule; RYGB, Roux-en-Y gastric bypass; RYGB-FMRR, Roux-en-Y gastric bypass plus fenofibrate, metformin, ramipril, and rosuvastatin; S1, S1 region of proximal tubule; S2, S2 region of proximal tubule; S3, S3 region of proximal tubule; SD, Sprague Dawley; SHAM, sham surgery (laparotomy).

