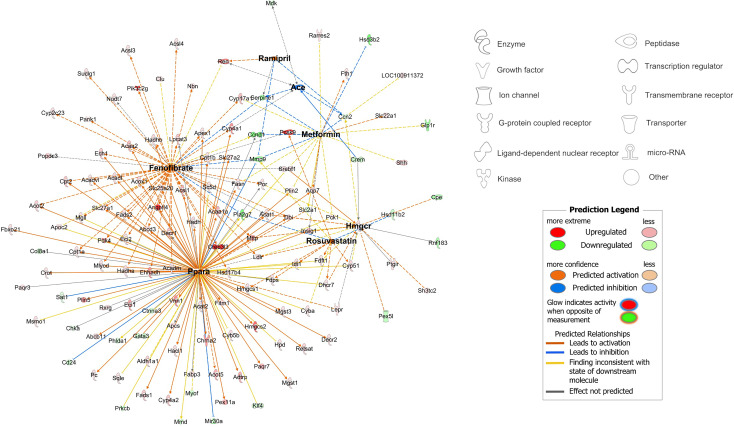
Figure 5.
Network visualisation of medication-responsive genes which were differentially expressed between the RYGB-FMRR and RYGB groups. The network was constructed using the ‘My Pathways’ interface in IPA, and edited using ‘PathDesigner’ in IPA. The four medications administered to rats treated with RYGB-FMRR, and their corresponding drug targets, are bolded. The legend outlines node symbols corresponding to molecule types contained within the network. The directionality of gene expression change in the RYGB-FMRR vs RYGB DEG list is displayed by node colour (red = upregulated; green = downregulated). Relationships between medications and their gene targets are illustrated by edge colour (orange = predicted activation; blue = predicted inhibition). DEG, differentially expressed gene; IPA, Ingenuity Pathway Analysis; RYGB, Roux-en-Y gastric bypass; RYGB-FMRR, Roux-en-Y gastric bypass plus fenofibrate, metformin, ramipril, and rosuvastatin.

