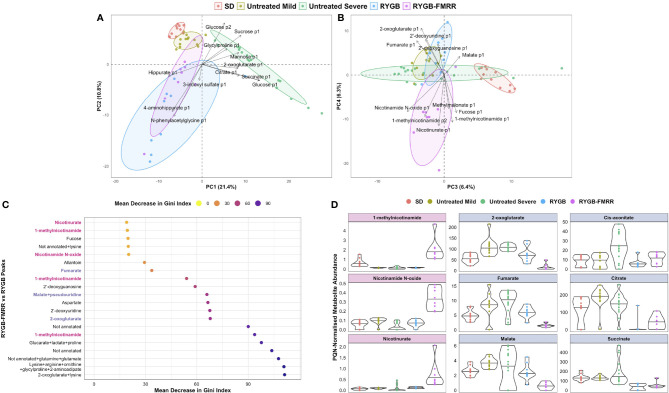
Figure 6.
Characterization of urinary metabolomic changes following RYGB and RYGB-FMRR. (A, B) Principal component analysis biplots of PQN-normalized urinary 1H-NMR peaks obtained before and at 4 weeks after intervention (A, principal components 1-2; B, principal components 3-4). Baseline and follow-up samples from SD rats were considered together given the lack of change in metabolomic profiles evident in this group. Samples from SHAM rats at baseline and follow-up were considered alongside baseline samples from RYGB and RYGB-FMRR rats, and collectively designated as untreated ZDSD rats. Untreated ZDSD rats clustered based on disease severity into two subphenotypes, mild and severe, rather than by timing of sampling or by experimental group assignment. The definition of disease severity in this context was based on patterns of urinary metabolomic changes influencing subphenotypes observed after clustering of rats by principal component analysis. RYGB and RYGB-FMRR reflect post-intervention values in these two groups. Arrows indicate loading vectors of metabolites driving separation of the groups along principal components 1-4. (C) Dotplot of urinary 1H-NMR peaks ranked by importance to classification of RYGB and RYGB-FMRR groups in random forest modelling (70). Peaks are displayed in descending rank order from left to right according to the variable importance metric, mean decrease in Gini index. Variable importance estimates are mean values derived from 100 model repetitions. Multiple peaks were identified for certain metabolites and some peaks remained unannotated despite 2-D NMR analysis. When multiple metabolites are present in a given peak, metabolites are listed in order of relative abundance in the peak, with the most abundant metabolite listed first. PPARα biomarker metabolites involved in nicotinamide metabolism are highlighted in pink; TCA cycle intermediates are highlighted in blue. (D): PQN-normalized abundance of metabolites according to the groups outlined in the PCA biplots in (A, B) The first column reflects PPARα biomarker metabolites involved in nicotinamide metabolism (pink panels). The second and third columns reflect TCA cycle intermediates (blue panels). The raw spectra and spectral processing in the R package Speaq was manually reviewed for these metabolites to ensure that the between-group differences highlighted are not artefactual (64). Illustrative examples of the raw spectra and spectral processing in Speaq for the 1-methylnicotinamide and 2-oxoglutarate peaks are presented in Supplemental Figure 1 . NMR characteristics of the peaks are presented in Supplemental Table 1 . 1H-NMR, proton nuclear magnetic resonance spectroscopy; 2-D, two-dimensional; p1, peak 1; p2, peak 2; PC, principal component; PQN, probabilistic quotient normalization; RYGB, Roux-en-Y gastric bypass; RYGB-FMRR, Roux-en-Y gastric bypass plus fenofibrate, metformin, ramipril, and rosuvastatin; SD, Sprague Dawley; SHAM, sham surgery (laparotomy); TCA, tricarboxylic acid; ZDSD, Zucker Diabetic Sprague Dawley.

