Figure 7.
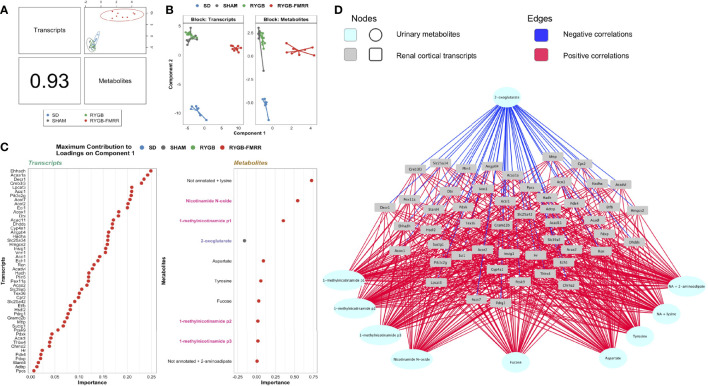
Multi-omic integration of the renal cortical transcriptome and urinary metabolome identifies a distinctive gene-metabolite signature following RYGB-FMRR. (A) A supervised, sparse partial least squares-discriminant analysis model was fit to regularized log-transformed gene expression counts and annotated, PQN-normalized urinary 1H-NMR peaks from 4 weeks after intervention using the DIABLO framework in the R package mixOmics (72, 73). An overview of the correlation structure between transcripts and metabolites selected by component 1 of the model, which separated RYGB-FMRR rats from the three other experimental groups, is presented. The left lower panel indicates the Pearson’s correlation coefficient between transcripts and metabolites, and the top right panel presents a scatterplot of the correlation structure between the two omics datasets for each sample. Each dot represents an individual rat, with colours indicating experimental group assignment. (B) Dimensionality reduction plot of the subspace spanned by the latent variables of the sparse DIABLO model indicating clustering of experimental groups along component 1 (x-axis) and component 2 (y-axis). The plot is facetted by omics modality such that one panel each is presented for transcripts and metabolites. Based on renal cortical transcript expression and urinary metabolite abundance, RYGB-FMRR rats separated from the other experimental groups along component 1. Each dot represents an individual rat, with colours indicating experimental group assignment. (C) Dotplots illustrating the contribution of each selected feature (n=50 transcripts, n=10 metabolites) to component 1 of the sparse DIABLO model. Dots are ordered from top to bottom and from right to left according to the loading weight (importance) of the feature. The loading weight can be positive or negative and ranking is by absolute values. The colour of dots corresponds to the group in which the feature is most abundant. Some metabolites in urinary 1H-NMR peaks remained unannotated despite 2-D NMR analysis. When multiple metabolites are present in a given peak, metabolites are listed in order of relative abundance in the peak, with the most abundant metabolite listed first. PPARα biomarker metabolites involved in nicotinamide metabolism are highlighted in pink; TCA cycle intermediates are highlighted in blue. (D) Network visualization of the correlation structure between the 50 transcripts and 10 metabolites selected by component 1 of the sparse DIABLO model. Correlations between features with an absolute value greater than 0.5 are presented. Metabolites are presented at the periphery of the network as cyan spherical nodes. Transcripts are presented towards the middle of the network as grey rectangular nodes. Edges are coloured by the directionality of correlation between nodes: blue for negative correlations, red for positive correlations. 1H-NMR, proton nuclear magnetic resonance spectroscopy; DIABLO, data integration analysis for biomarker discovery using latent variable approaches for omics studies; NA, not annotated; p1, peak 1; p2, peak 2; p3, peak 3; PLS-DA, partial least squares-discriminant analysis; PQN, probabilistic quotient normalization; RYGB, Roux-en-Y gastric bypass; RYGB-FMRR, Roux-en-Y gastric bypass plus fenofibrate, metformin, ramipril, and rosuvastatin; SD, Sprague Dawley; SHAM, sham surgery (laparotomy); TCA, tricarboxylic acid.

