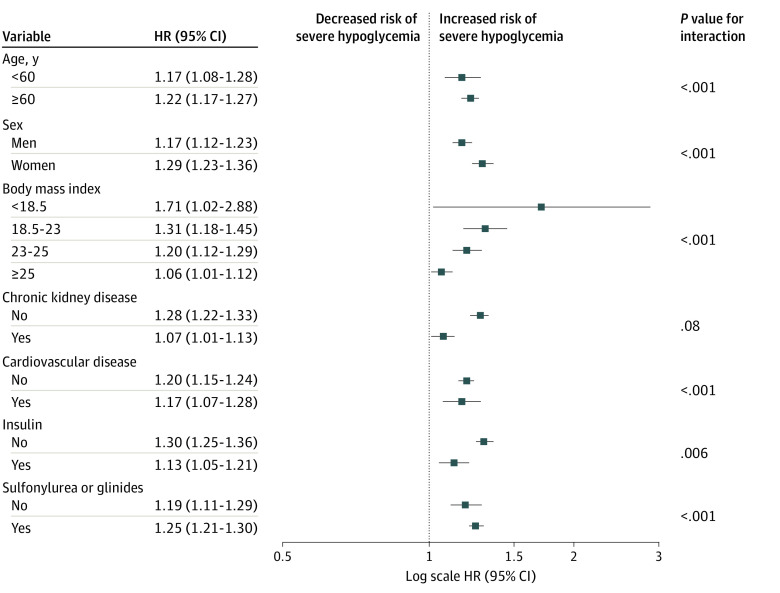
Figure 2. Adjusted Hazard Ratios (HRs) for Severe Hypoglycemia in the Group With Fatty Liver Indices of 60 or Greater vs Those with Fatty Liver Indices of Less Than 0, by Subgroup.
Cox proportional hazard regression models were used to estimate HRs and 95% CIs. Models were adjusted for age; sex; smoking and alcohol habits; exercise; body mass index (calculated as weight in kilograms divided by height in meters squared); severe hypoglycemia within previous 3 years; insulin, sulfonylurea, or glinides use; and history of hypertension, chronic kidney disease, and cardiovascular disease. Error bars indicate 95% CIs.

