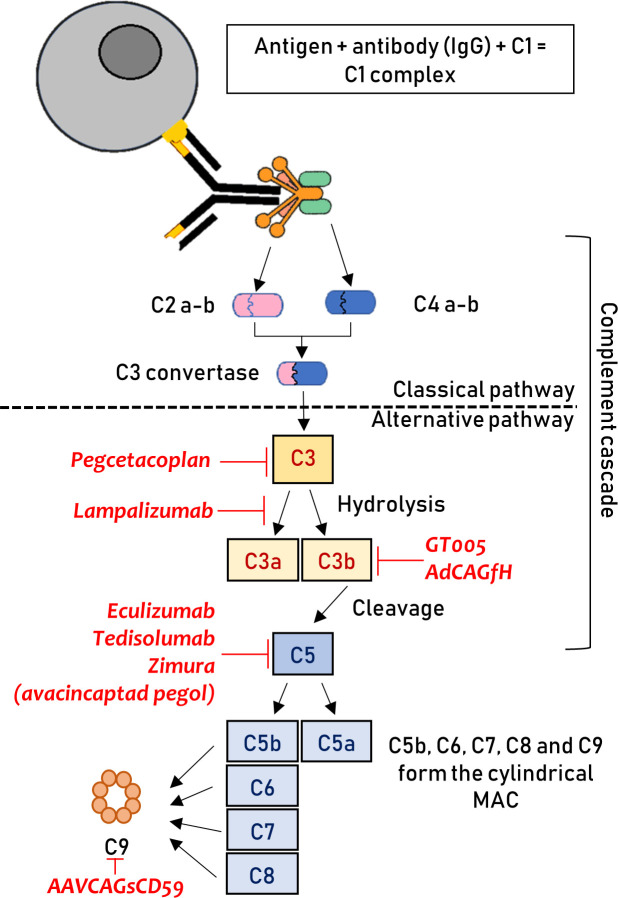
Figure 1.
Graphical representation of the complement cascade. The location where different therapeutics act is highlighted. The therapies are shown, with them all have a downregulating effect on the particular step, negatively impacting on the downstream pathway. This figure has been created by the authors. C, complement; IgG, immunoglobulin G; MAC, membrane attack complex.

