
Figure 2. Receptor - toxin interactions.
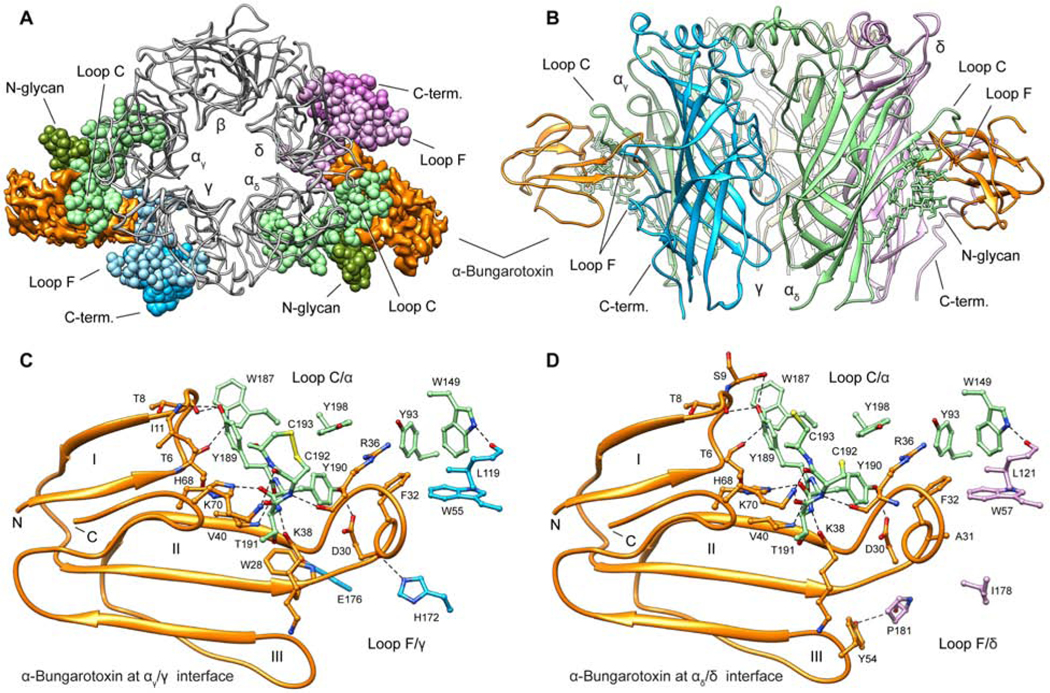
(A, B) Top and side views of receptor ECD – toxin complex showing the α-bungarotoxin bound to αγ/γ and αδ/δ interfaces; Loop C, N-glycan, Loop F and C-terminus residues are showing as sphere in top view. (C, D) Interacting residues are shown as sticks colored by subunit and α-bungarotoxin as orange ribbon. α subunits are in green, γ subunit in blue and δ subunit in violet. Dashed lines indicate electrostatic interactions. Roman numerals indicate the three fingers of α-bungarotoxin.