
Figure 2:
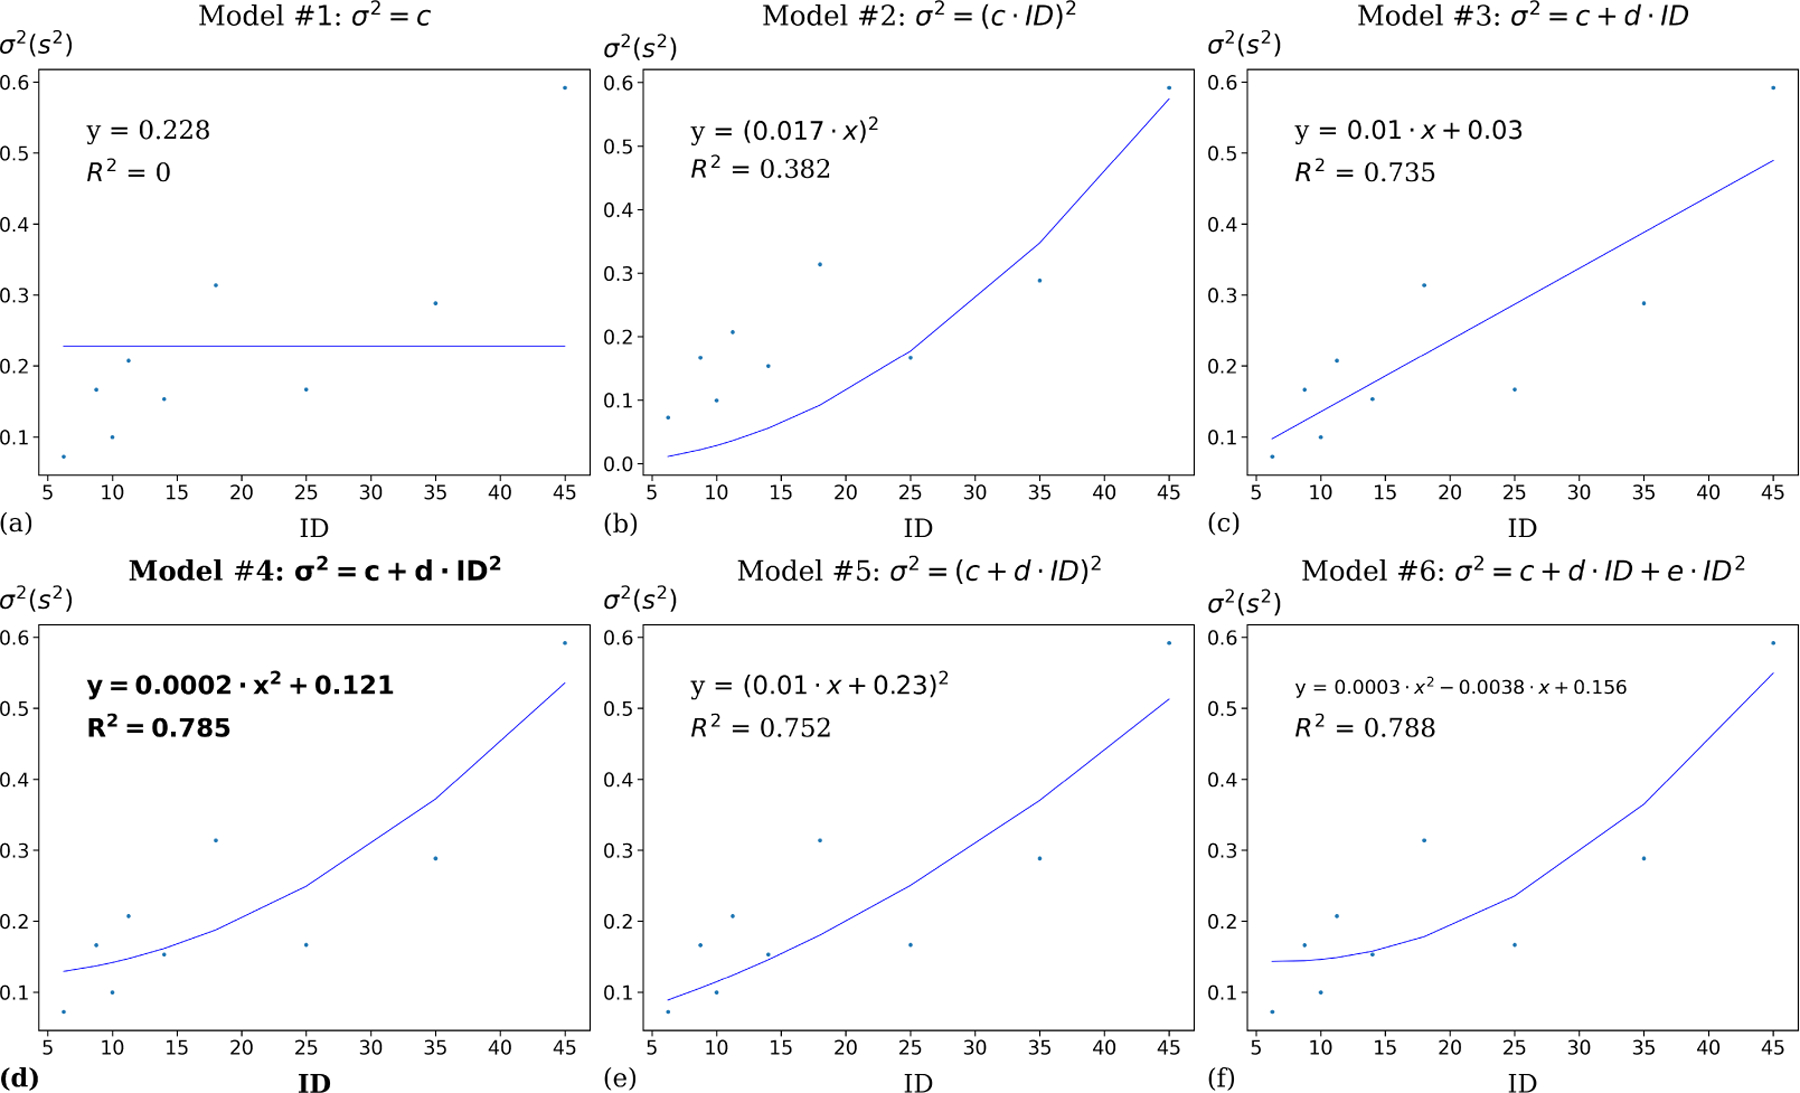
σ2 vs. ID regression for 6 variance models on the Zhou and Ren’s straight tunnel dataset. As shown, the quadratic-variance model (Model #4 in Table 1) accounts for 78.5% of variance in the observed variance of MT. It performs the best according to AIC, WAIC, and leave-one-(A, W)-out cross-validation. Model #6 in Table 1 has the highest R2, but overfits the data because it has higher RMSE in leave-one-(A, W)-out cross-validation compared with quadratic variance model.