
Figure 4:
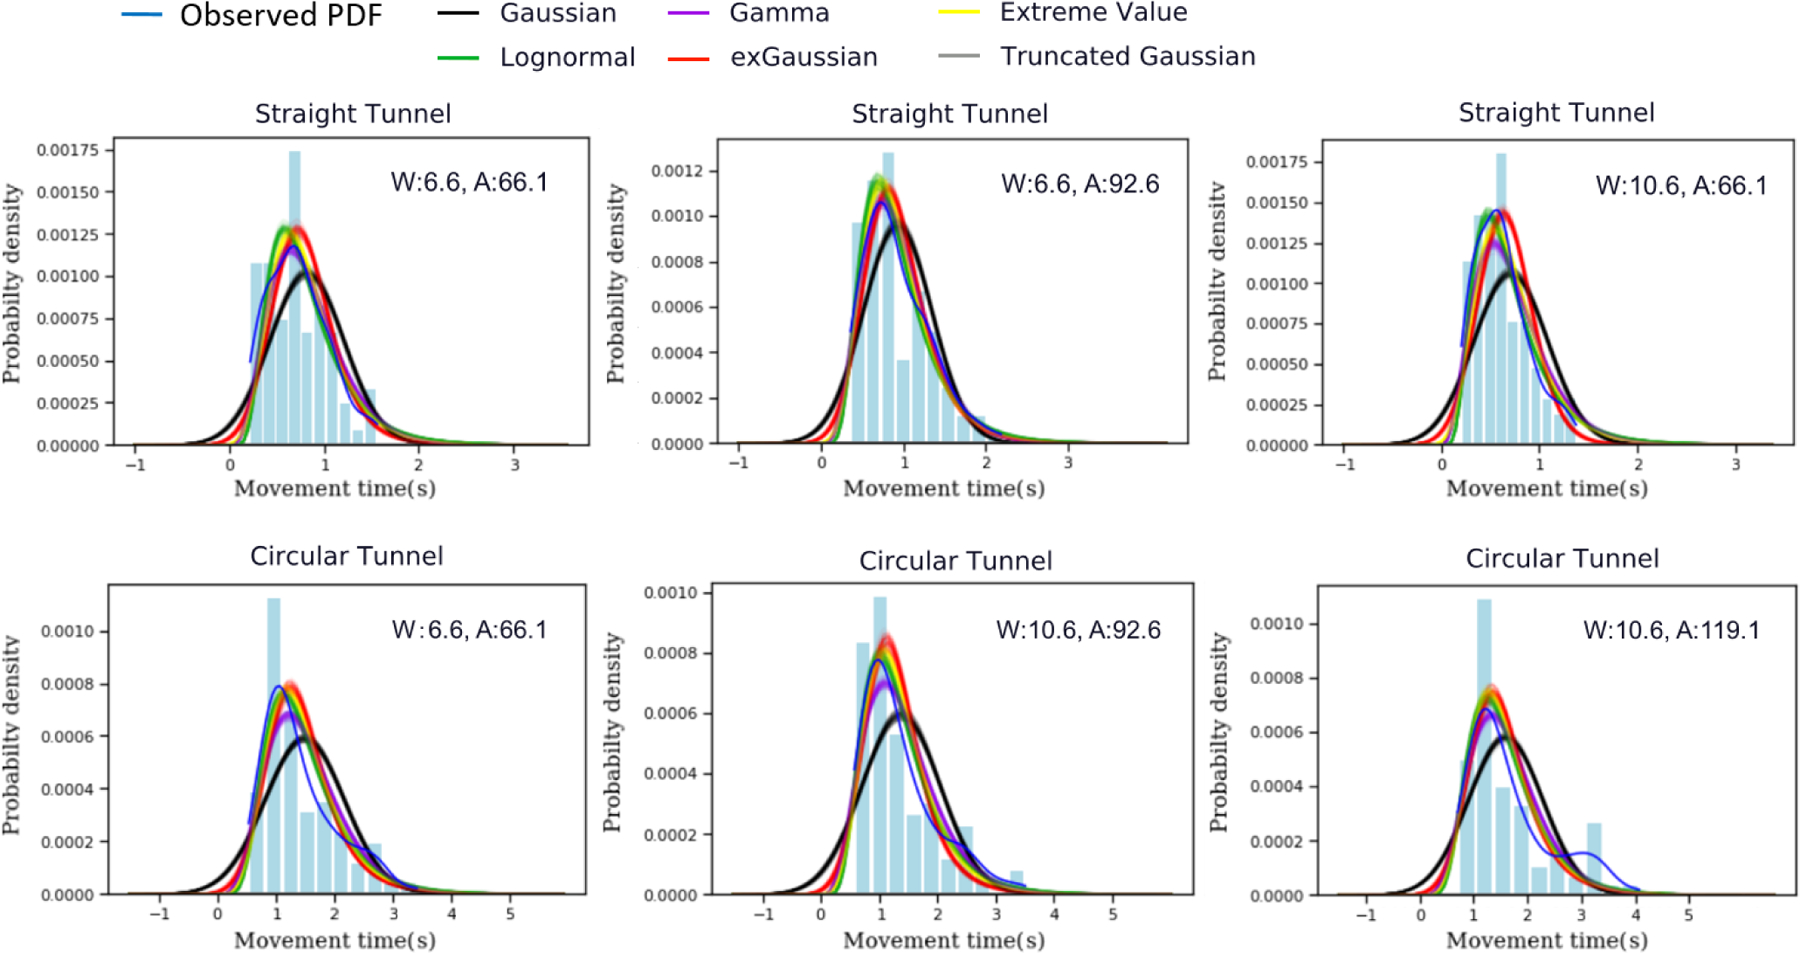
Posterior Predictive Checking on Probability Density Functions (PDF) of MT in 3 amplitude-width (A, W) conditions in each of the straight and circular tunnel tasks on the Zhou and Ren’s steering law dataset. The blue curves are the observed PDF and the light blue bars are observed histogram. The other colored curves are predictions made by different models. All the predictions were drawn from 100 simulations. The narrow bands represent the uncertainty. As shown, the Lognormal (green), Gamma (violet), Extreme value (yellow), and exGaussian (red) looked very similar to the observed PDF (blue), and outperformed models with Gaussian and truncated Gaussian (black and grey).