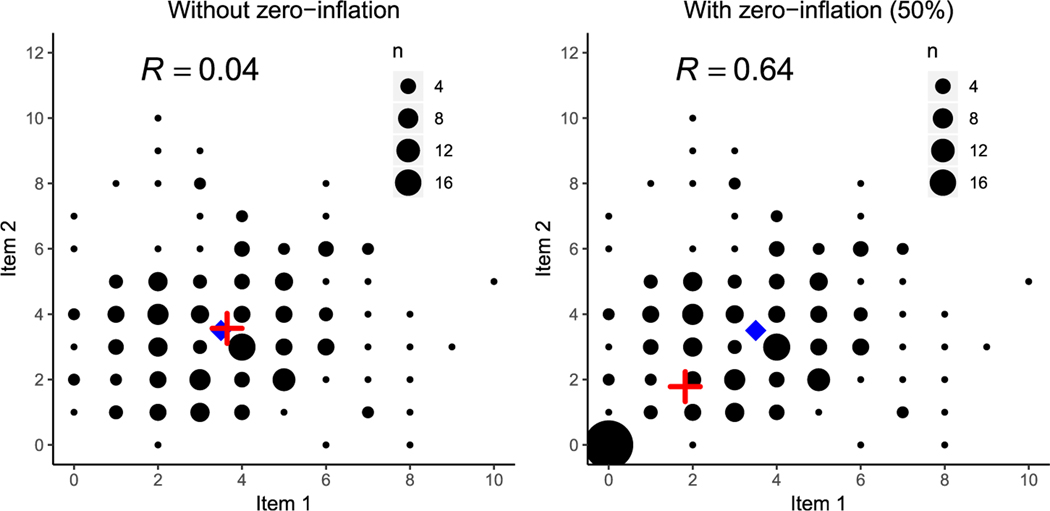
Figure 2.
Counting plots of two independent Poisson variables, without zero-inflation in the left panel and with 50% zero-inflation in the right panel. The population mean is marked by a blue diamond and the observed mean is marked by a red cross. The excess zeros shift the observed mean away from the true mean and induce a strong positive correlation.

