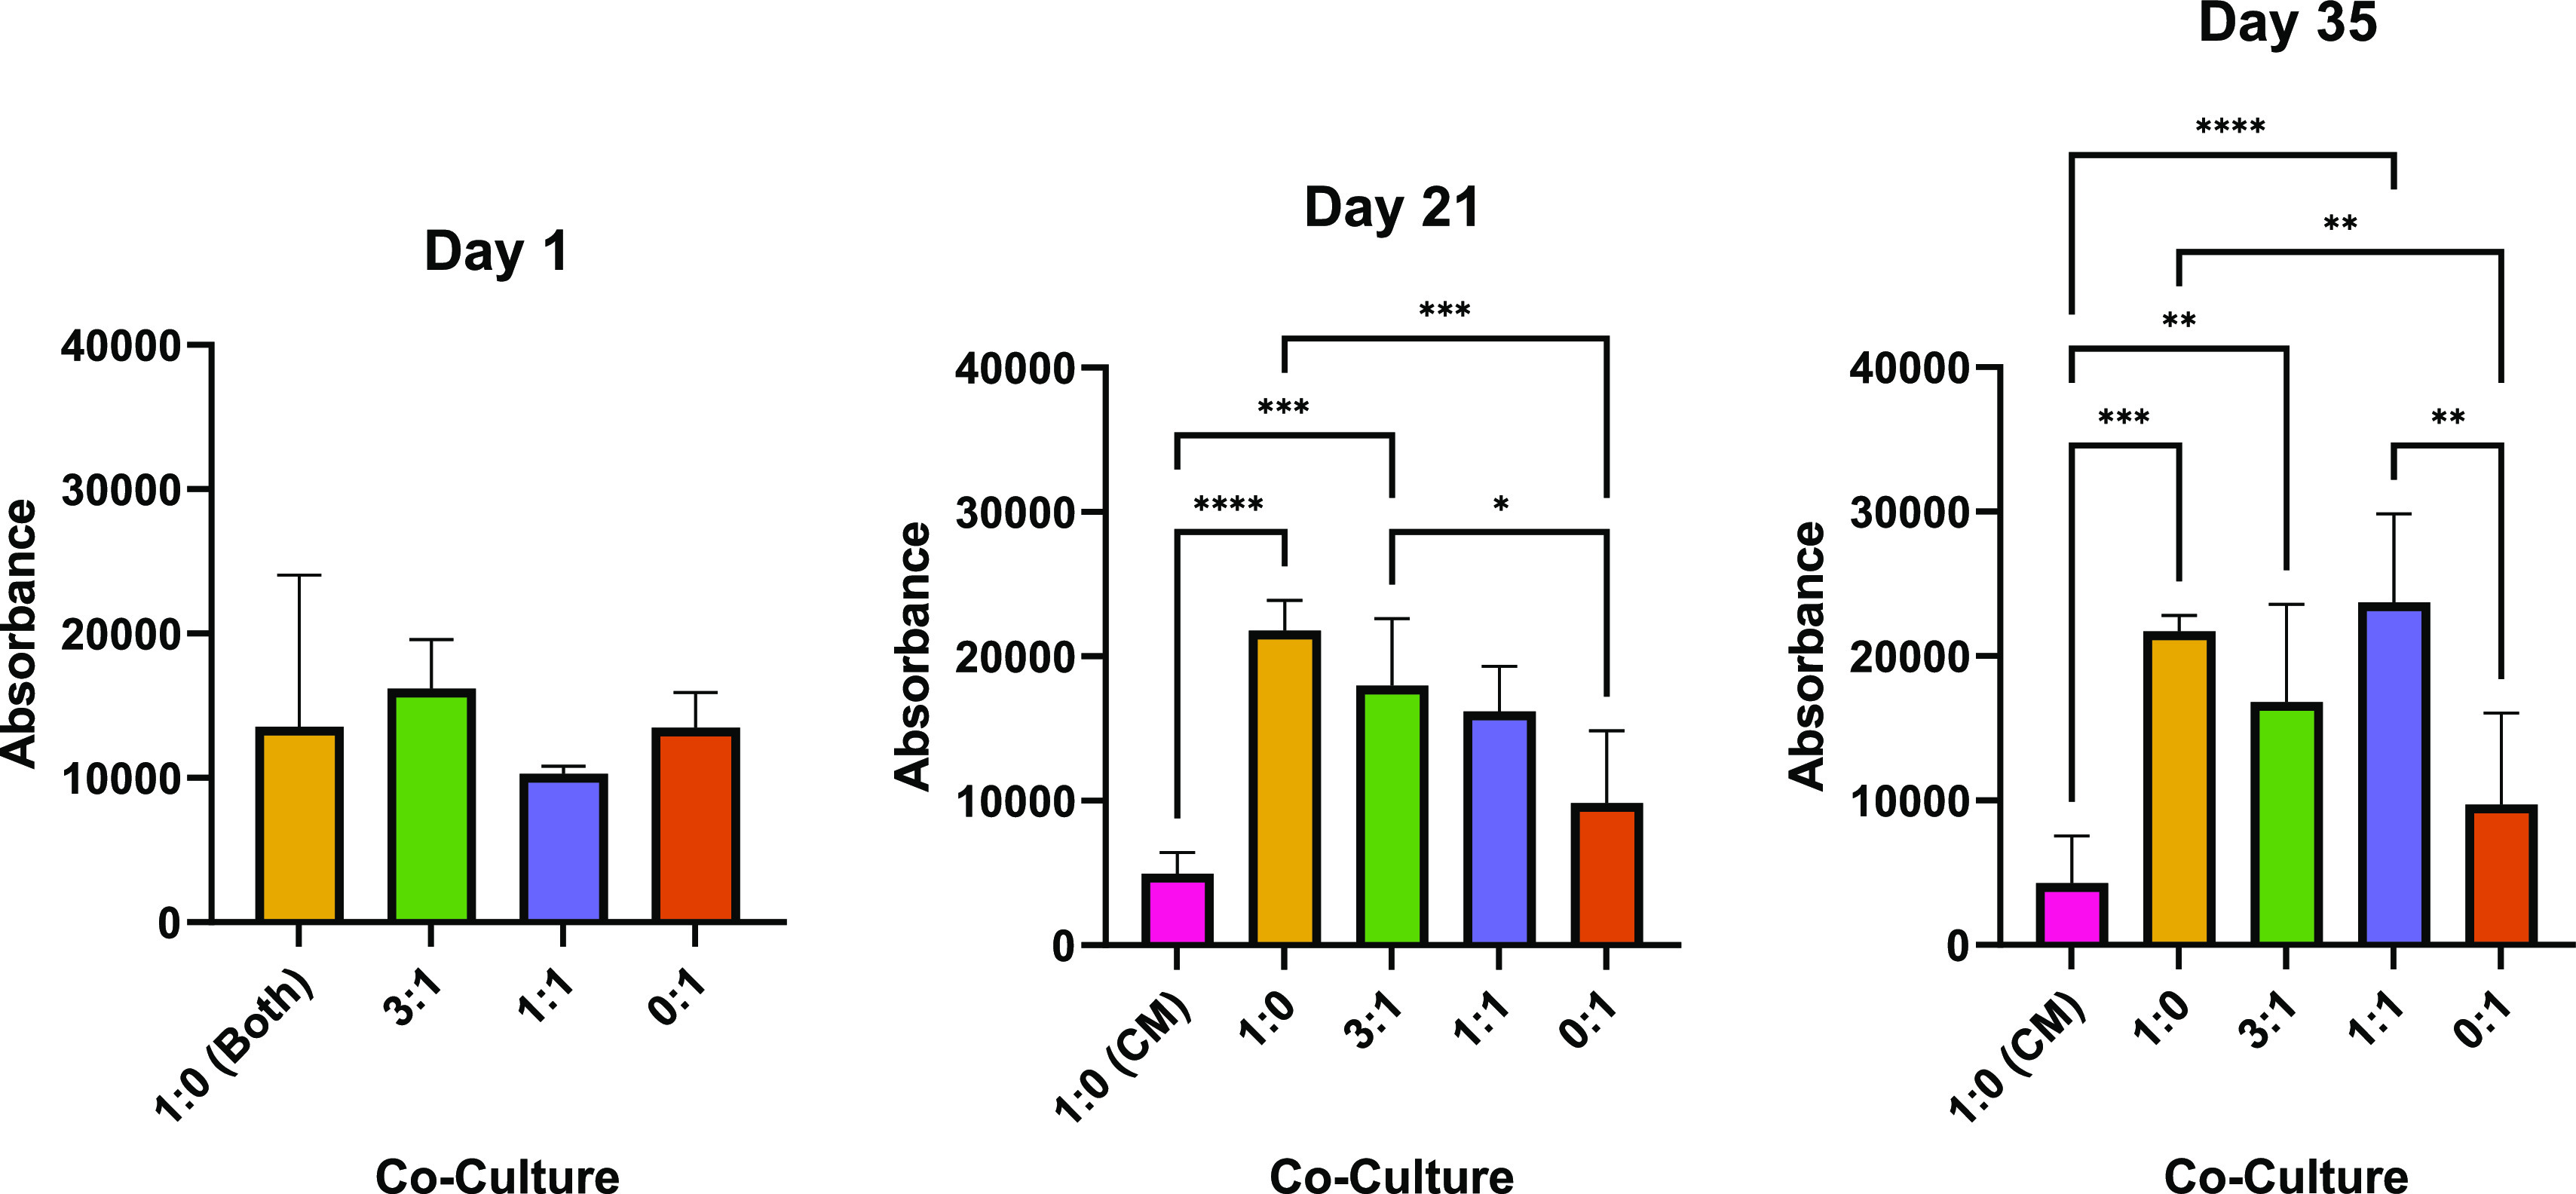
Figure 3.

Co-culture proliferation. Bar charts demonstrates statistical significance of cell proliferation comparing the co-culture MSC/PC ratios of 1:0, 3:1, 1:1, and 0:1 (cultured in differentiation media) as well as 1:0 cultured in MSC-CM (1:0 CM) (n = 6). Error bars represent standard deviation between biological replicates, and significance was calculated with one-way ANOVA, where: * = <0.05, ** = <0.01, and *** = <0.001. 1:0 (both) refers to 1:0 scaffolds cultured in both differentiation media and MSC-CM.
