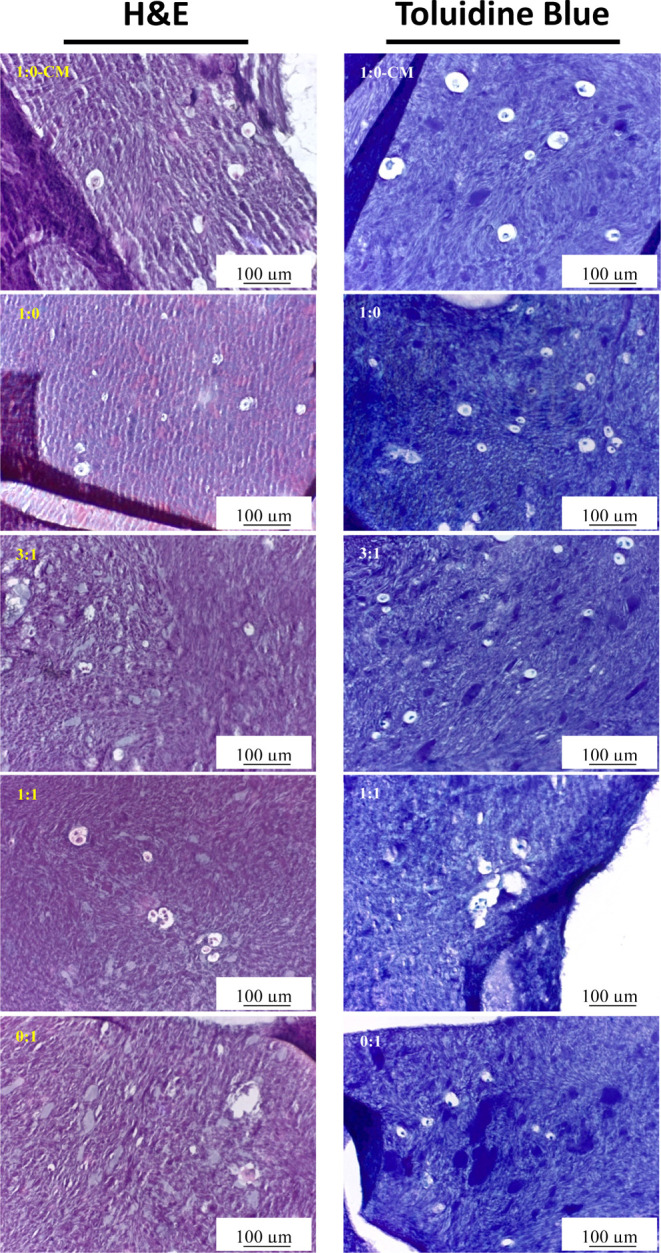
Figure 5.

Histology. H&E (left) and toluidine blue (right) images of cell cultures (n = 3) under the microscope, ×20 magnification; scale bars represent 100 μm. H&E staining was used to determine ECM deposition, and toluidine blue staining was used to evaluate the synthesized GAGs in the bioink (observed with purple/violet tinge) after 35 days of culture.
